


Data Studio (formerly Looker Studio) is a data visualization tool that I particularly like because it’s very flexible and lets you combine multiple data sources. This means you can create an SEO dashboard by connecting your Google Search Console property to pull in your rankings, impressions, and more. The advantage is that you can easily create your own charts and apply filters. Here’s how to do it, even if you’re a beginner.
In summary
- There is an official (and free) Google Search Console connector for Data Studio
- By default, I recommend selecting “Impressions associated with the URL,” but you’ll notice that the numbers differ from those in GSC
- To save time and create a professional-looking report, you can use one of my Data Studio dashboards for SEO!
How do I add Google Search Console to a Looker Studio report?
Step 1: Add a new data source
In your Data Studio dashboard, click the “Resources” menu, then select “Manage new data sources.” Next, click “Add a new data source” if the option is available. Otherwise, you’ll be redirected automatically.
Step 2: Find the connector
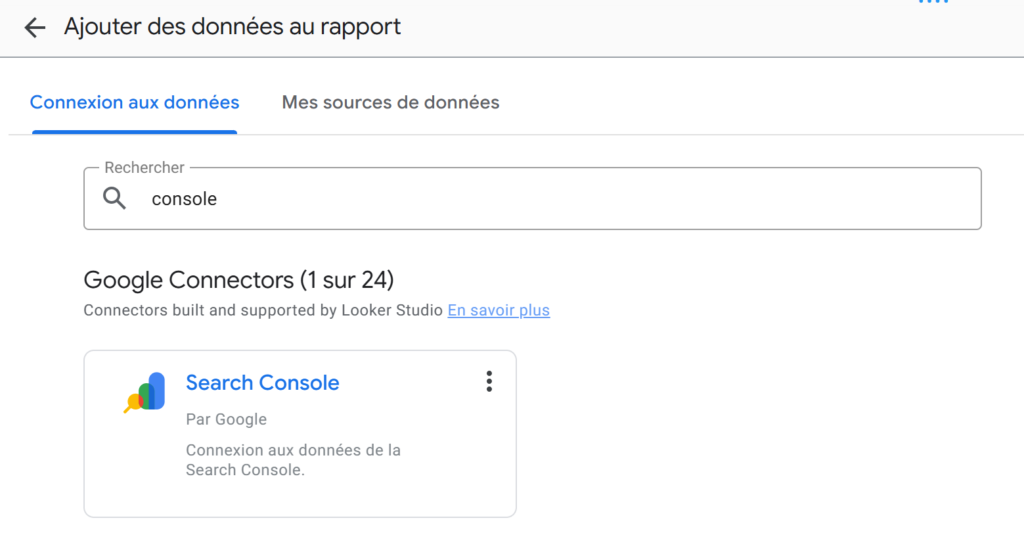
Type “console” into the search bar to find the official Google Search Console link (if you type “Google” first, you won’t find it…).
EXPERT ADVICE
There are also connectors developed by other companies that sometimes allow you to access additional data. They are rarely free, and may sometimes limit the amount of data you can access. I recommend the official connector!
Step 3: Choose the site
You will now need to sign in with your Google Search Console credentials. This is the Gmail account that gives you access to the property in question.
Once you’re signed in, you’ll see a list of sites for which you have ownership access in Google Search Console. Click the one you want to add.
Step 4: Choose the Right Data
This is where things get complicated. Once you’ve chosen a site, you have several options to choose from. Here are the differences in terms of tables:
- Impressions associated with the site: The metrics are aggregate; you won’t be able to see details by URL. This is the closest thing to your data in GSC. For example, if 4 of your pages appear for a keyword, this will count as 1 impression, not 4.
- Impressions associated with the URL: Here, the metrics are at the URL level (this is what I recommend if you want to analyze in detail). If you want to get statistics from Google Discover or Google News, this is what you should select. Just be aware that the data will be higher than what you see in GSC.
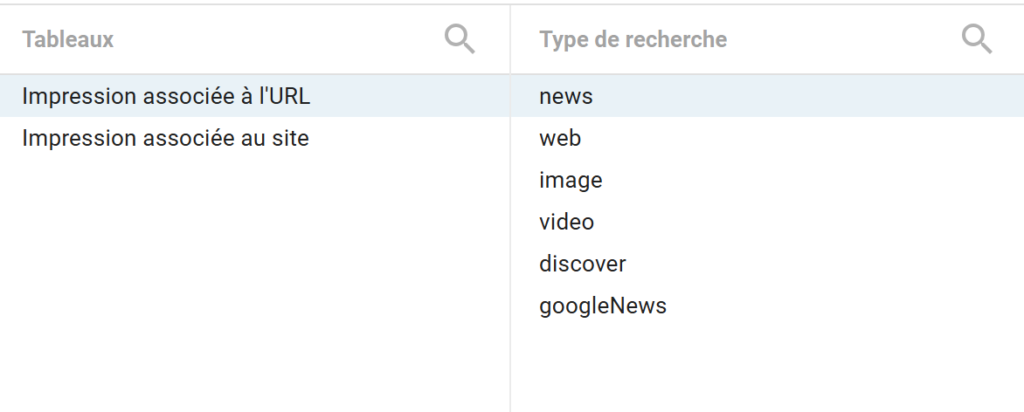
Next, you can choose from among the various Google platforms, but you can only select one at a time:
- Web: standard Google search
- Images: searches via the “Images” tab on Google
- Video: searches via the “Videos” tab on Google
- News: searches via the “News” tab
- Discover: traffic from the Google Discover feed
- Google News: traffic from the Google News feed
EXPERT ADVICE
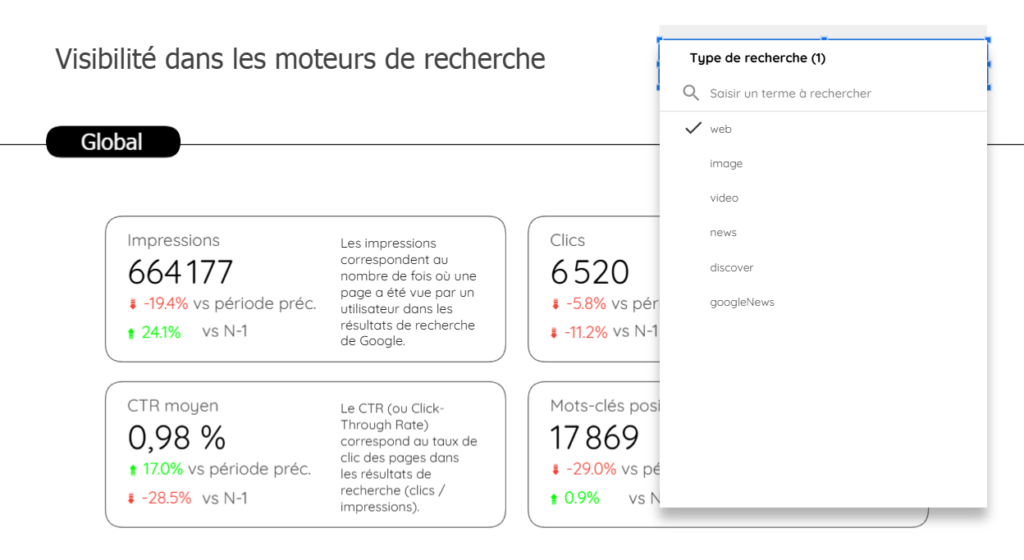
If you have traffic from multiple sources, you can add a field to switch between search types directly in your chart! This will update all your charts, but you won’t be able to compare the data side by side. To do this, add a “Drop-down list” selector and then select “Search Type” in the Control Field.
Step 5: Configure Data Access
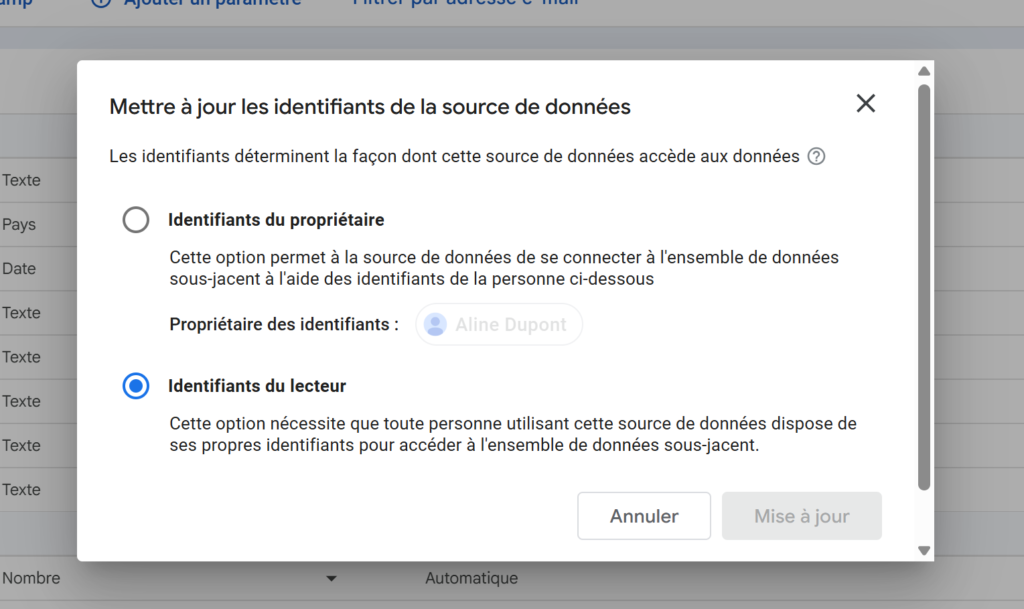
Next, I recommend that you click the “Data Access Credentials: User” button at the top.
You must choose between two options for accessing your data. Either you decide that users who access the dashboard can view the data even if they do not have access to your GSC property, or you choose the second option to ensure that only those who have access to the GSC themselves can view the data.
My Favorite Charts to Create in Data Studio Using the GSC
Once your data source is connected to Data Studio, all you have to do is create your charts using your data. Here’s a selection of my favorite Data Studio charts based on the GSC.
Trend Chart for Clicks and Impressions
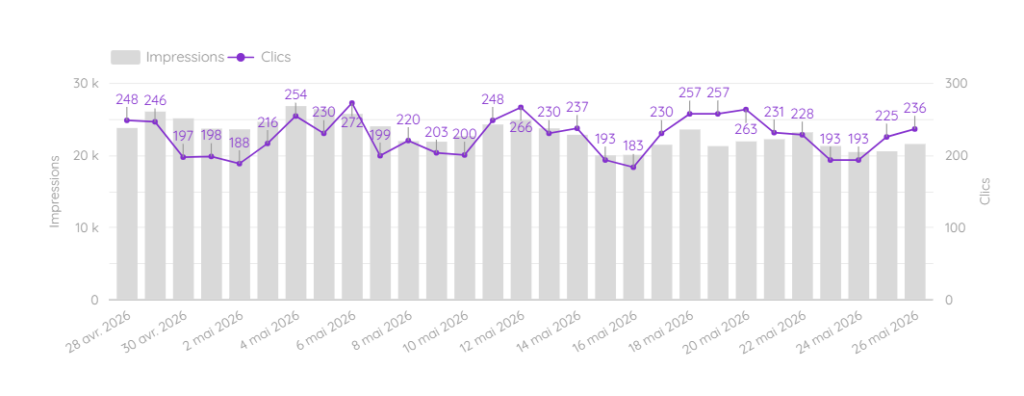
I like having both on the same chart, but you can also create two separate ones. I also recommend taking a broader view by looking at the month-by-month figures for the last 6 or 12 months.
Ranked Keywords and Traffic by Keyword Type
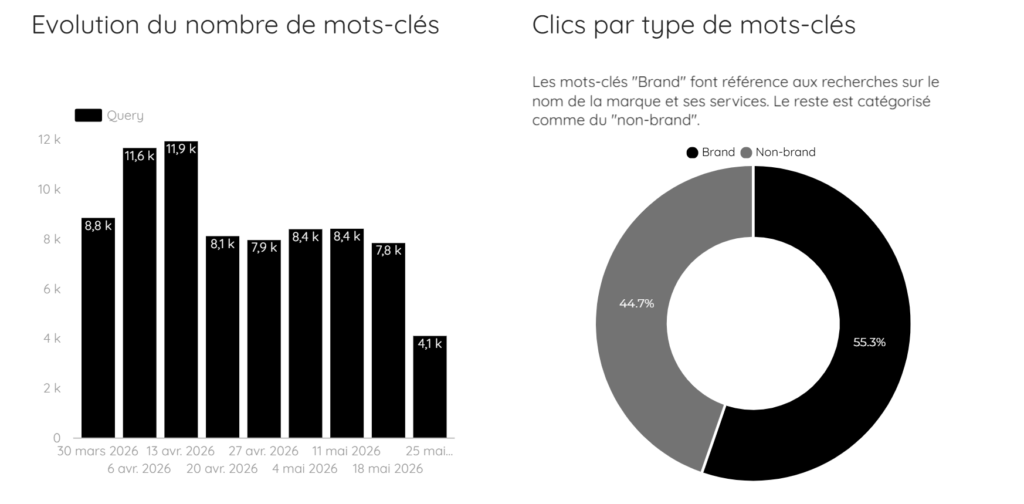
You can also track the number of keywords for which the site ranks over the course of weeks or months, as well as the distribution of clicks by keyword type. To filter brand traffic, you’ll need to create a custom field to separate brand and non-brand traffic. Then use this field as the breakdown in the pie chart.
Changes in Keyword Rankings
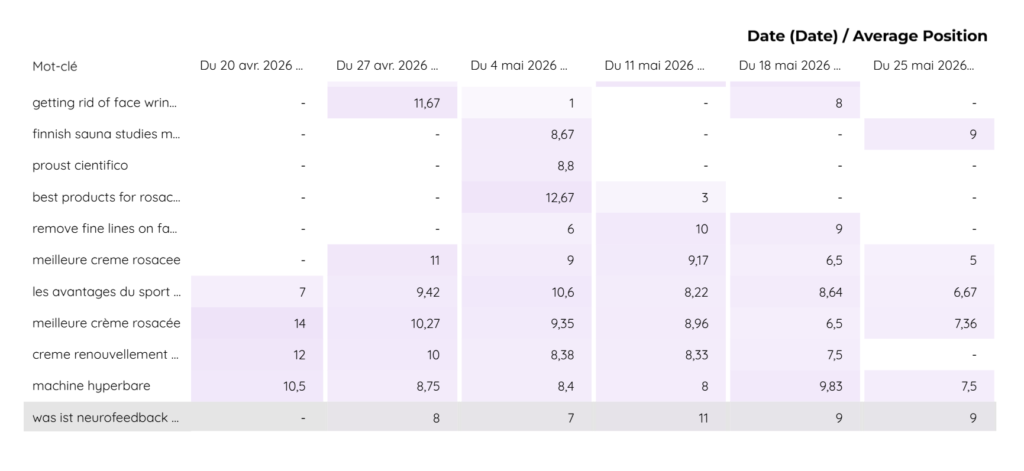
I also like to create a dynamic spreadsheet to track the rankings of all my keywords week by week or month by month. It’s a must-have when you’re doing SEO, and here you can do it in just a few clicks instead of struggling with Excel formulas.
Changes in Position and Cannibalization
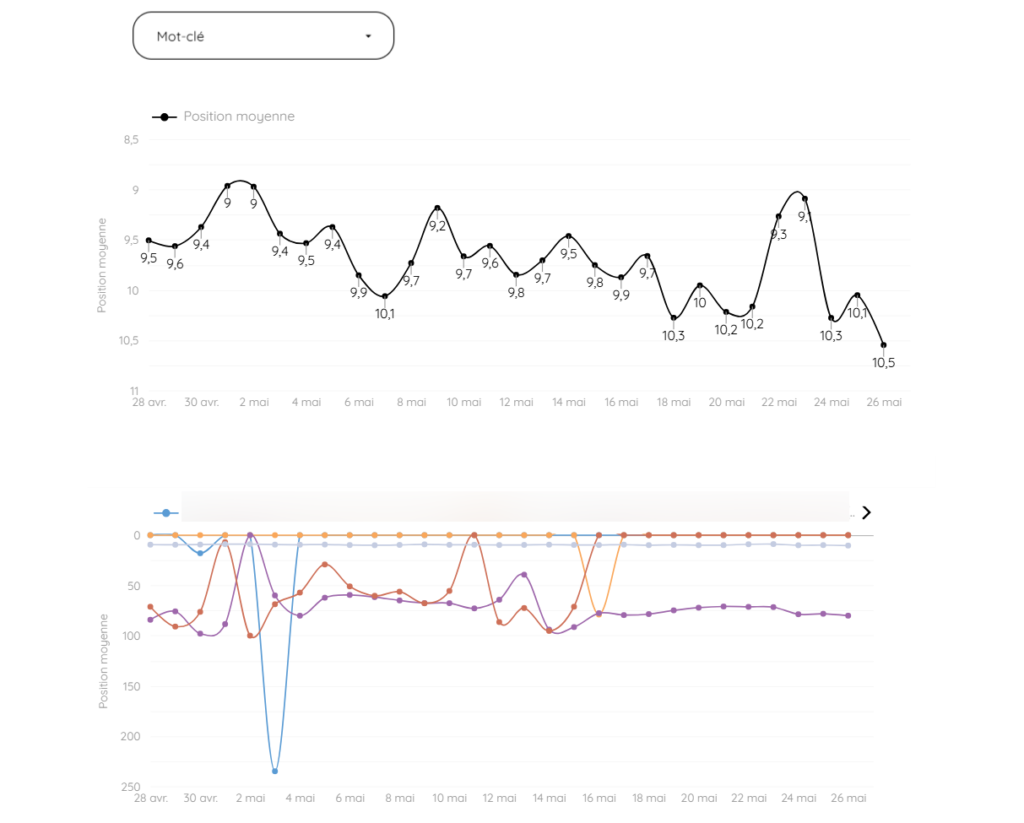
Finally, I recommend creating a line chart to track the ranking trend for a specific keyword, and creating a second one to see which pages are ranking over time. This is very useful for identifying instances of keyword cannibalization!
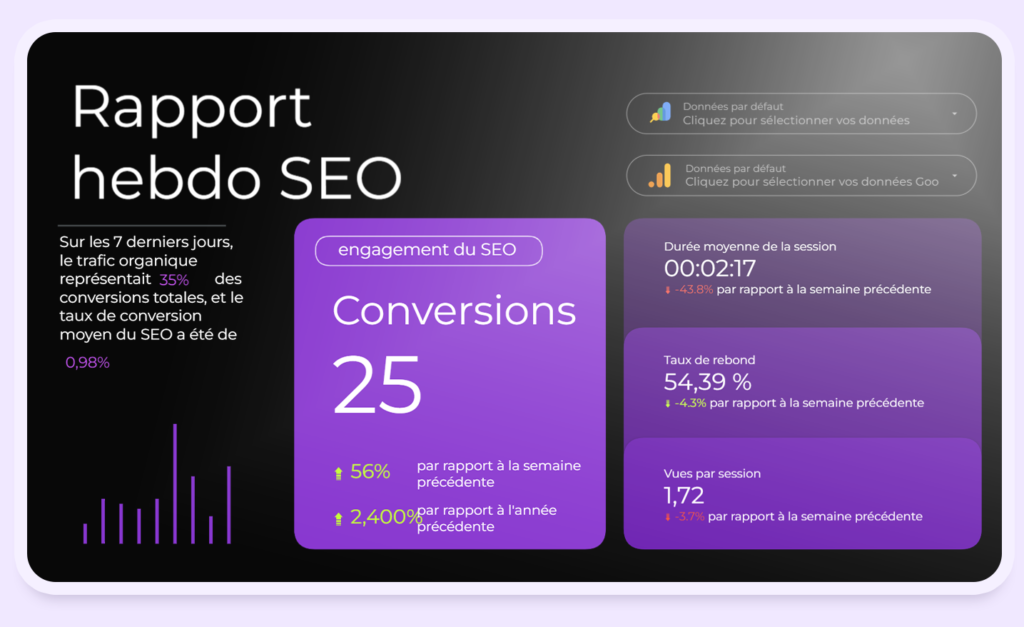
Use a Data Studio template that’s preconfigured for Search Console
If you don’t have time to learn Data Studio or don’t have a good eye for design, you can purchase one of my ready-to-use templates.
With just a few clicks, you can connect your Search Console property and view your data and that of your clients. Plus, I include practical guides to help you interpret the data like a pro with every purchase!
Leave a Reply