
Rush : Monthly SEO & AEO Report – Data Studio

319,00

Rush is an almost fully automated SEO/GEO reporting tool that allows you to collect and then present your essential KPIs to your clients or management, and to track the progress and impact of your actions. 😍 Get a professional and reliable report effortlessly. 🪄 Visualize the impact of your actions on your SEO/GEO visibility. 🏆 Finally, focus on the truly essential KPIs.

Accès à vie & mises à jour
100% personnalisable & marque blanche
Tutos d’installation et d’utilisation
Data sources
logo google search console

Google Search Console

logo google sheets

Google Sheets

GA4

Google Analytics

Metrics
Impressions
Clicks
Average position
Sessions
Views
Key events / Purchases
Top 3, top 10, top 20
Conversion rate
Bounce rate
Session duration
Views per session
Events per session
Backlinks
Referring domains
Mentions
404 errors
300 links

Dimensions
Branded / Non-branded
Date
Search engine / LLM
Content type
Keyword
Page
Mobile traffic
New / Returning user
Language
Goal
Task

Benefits

You save 3 to 4 hours per month on each client report. Producing a monthly report involves copying and pasting from GA4, GSC, Ahrefs, etc., then reformatting it in Slides or Sheets, and starting from scratch the following month. Rush centralizes everything in one place, and almost all the data is automatically imported.
You can finally show what SEO/GEO delivers. SEO and GEO are very opaque to clients and management. Until now, it’s been impossible to clearly correlate actions with changes in visibility. Rush allows you to concretely visualize the impact of actions on sessions and conversions through clear graphs.
You measure your visibility in AI, not just on Google. Clients are all starting to ask, “Do we appear in ChatGPT or Perplexity?” but no standard report answers that question yet. Rush does, which immediately positions the tool (and the agency using it) as a pioneer in the market.
You finally know which KPIs to track month after month. Especially when you’re starting out, it’s easy to get lost in tons of GA4 and GSC metrics and struggle to know what’s important. As an SEO, AEO, and CRO expert with over 7 years of experience, I’m sharing my essential KPIs with you.
Your client can clearly track the progress of the roadmap. In addition to the figures, the client (or your management) can monitor the achievement of set objectives and the tasks in progress. This will reassure them about your effectiveness.

Features

features rush

Sending automatic reports by email

GSheets file to be filled in with some manual data

White label design

Suitable for an e-commerce or editorial website

Duplicable for site-specific reporting

Easy PDF export

SEO and AEO traffic filters already applied

Weight of SEO/AEO in traffic and revenue

Estimating the keywords that generate the most revenue

Use Cases

At the end of each month, you spend two days producing reports that half your clients don’t even read. You know that good reporting should strengthen client relationships and demonstrate your value, but you no longer have the time to craft it as meticulously as you’d like. With Rush, 
you reduce your time per client from 3 hours to 30 minutes , and you deliver a report that people actually want to read.
You’ve just taken on 
a new SEO client with a chaotic history . No reporting in place, data scattered everywhere. Rush allows you to lay a clean foundation from the very first month: technical health, starting positions, objectives to achieve, and action roadmap.
You’ve helped a client with a website redesign and you 
‘re still unsure of the impact it’s had on their SEO . Thanks to Rush, you’ve noticed that session and conversion rates have steadily increased since the site went live. Your client is happy!

Structure

FNb3Md7gJ3

Page 1 – Introduction

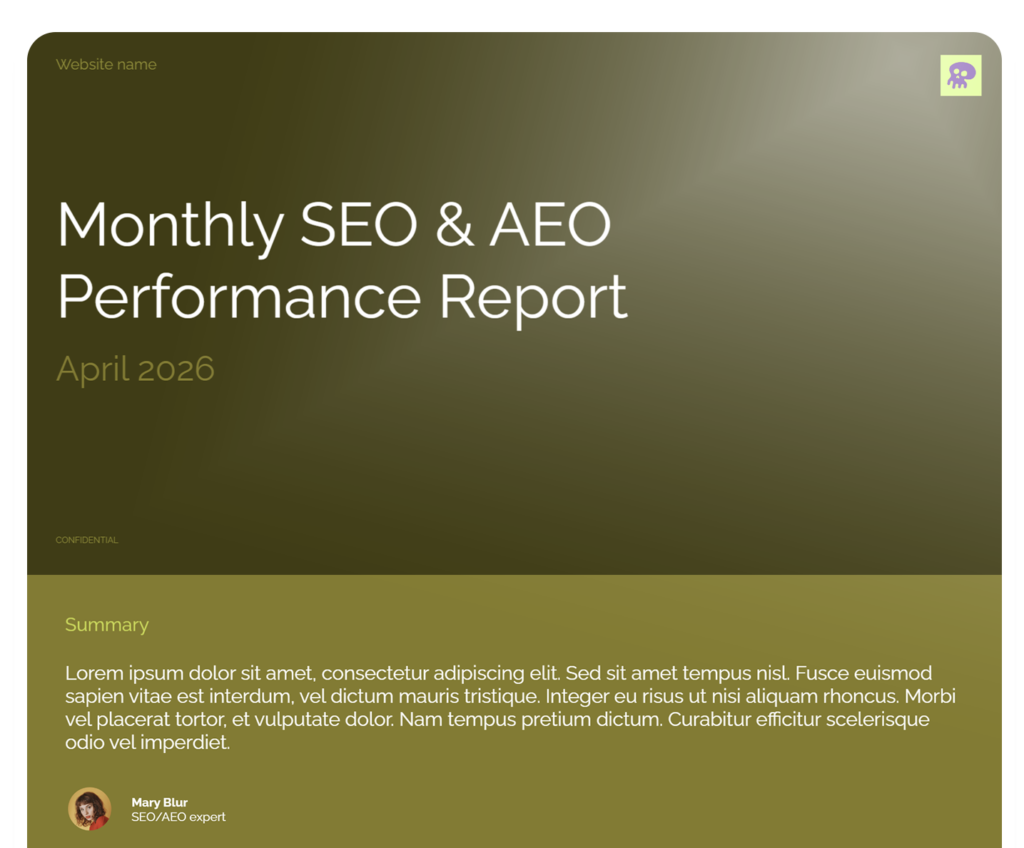
This cover page simply introduces the report, with the title and the name of the company/client.
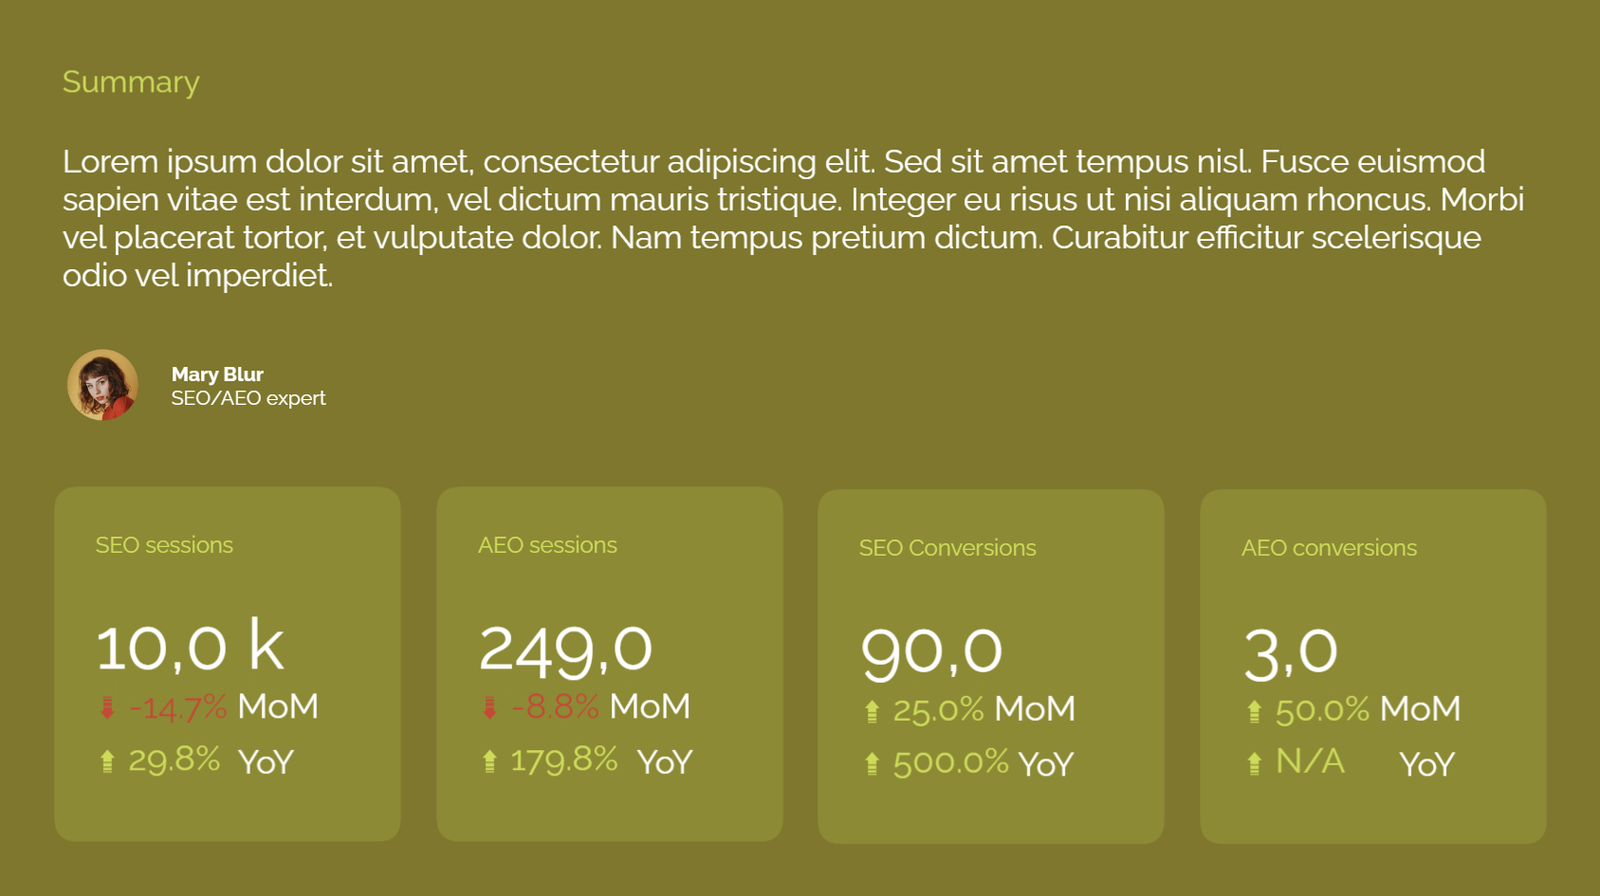
Page 2 – Summary

Here you can add an overall comment on performance and get a quick overview of key figures.
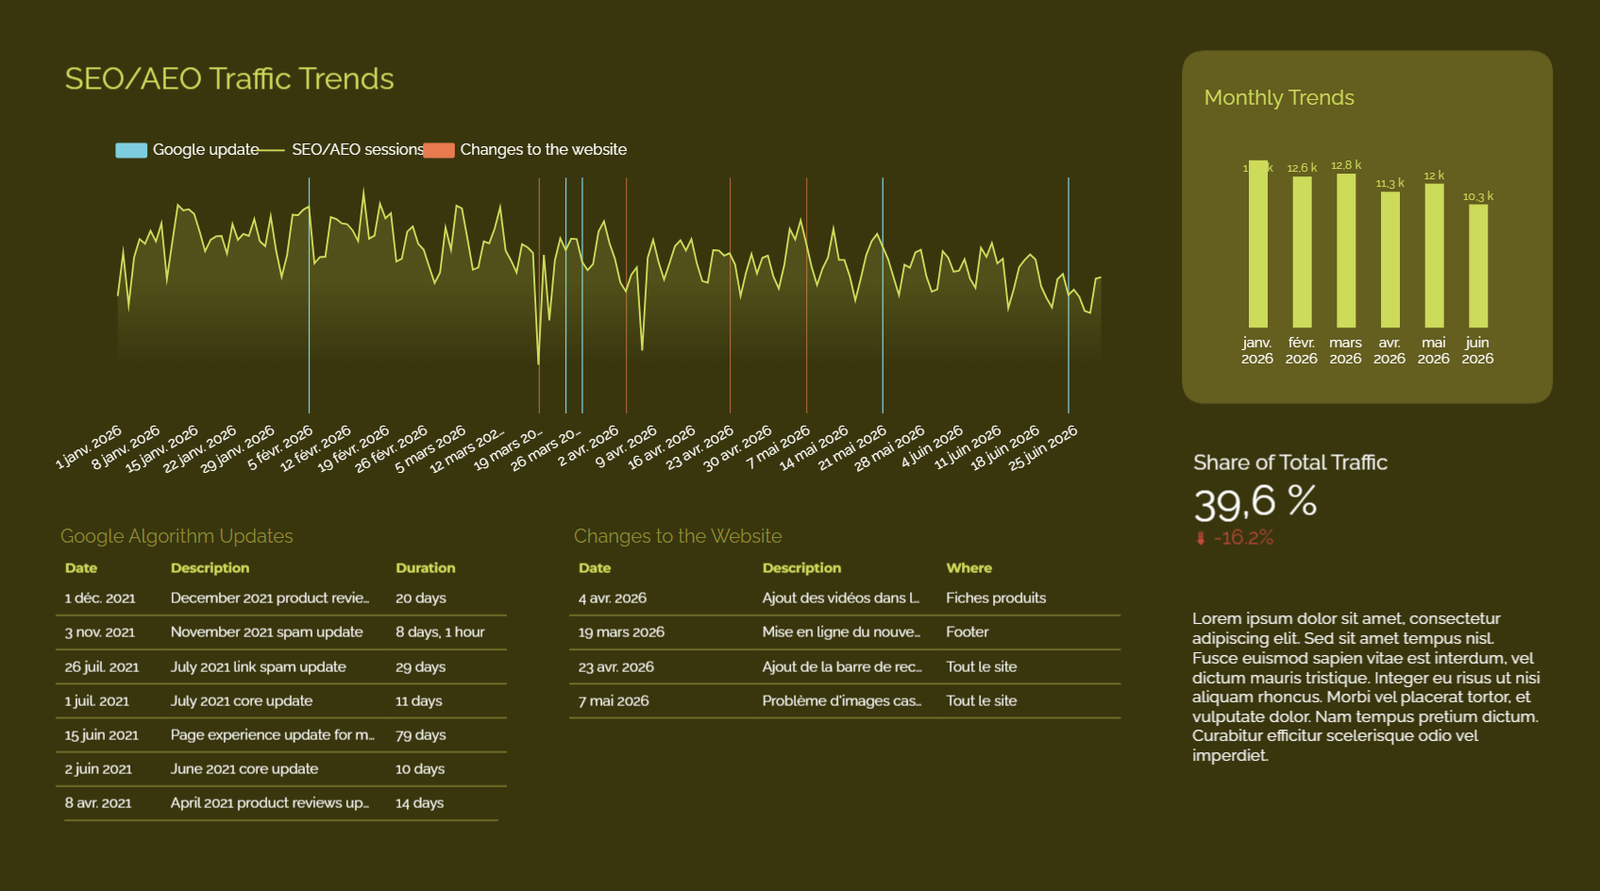
UY7V4JPRji

Page 3 – Traffic Trends

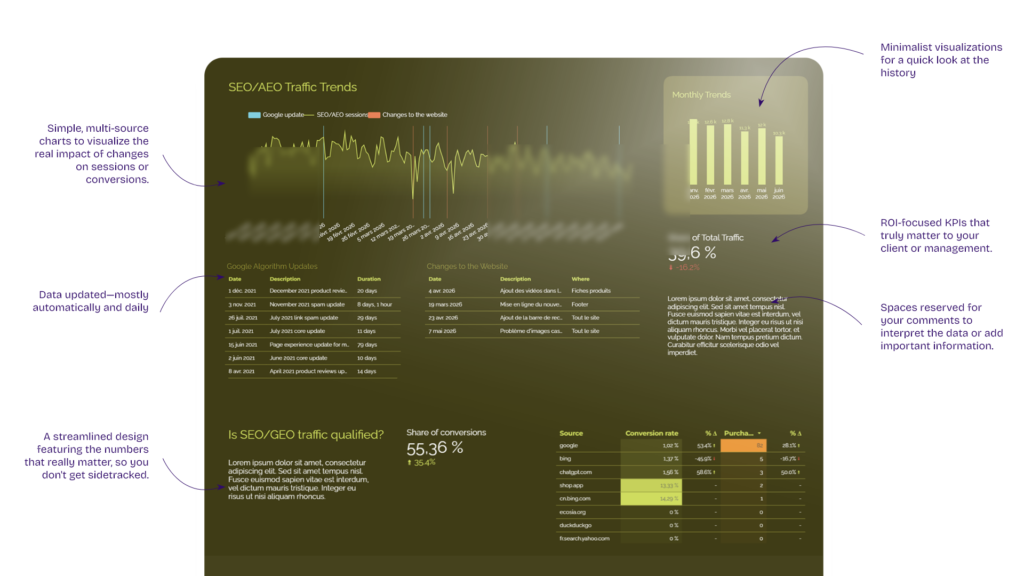
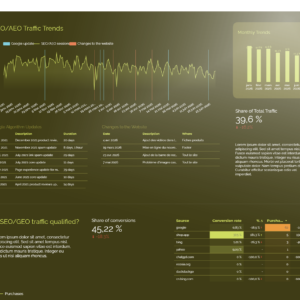
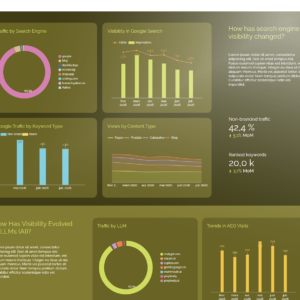
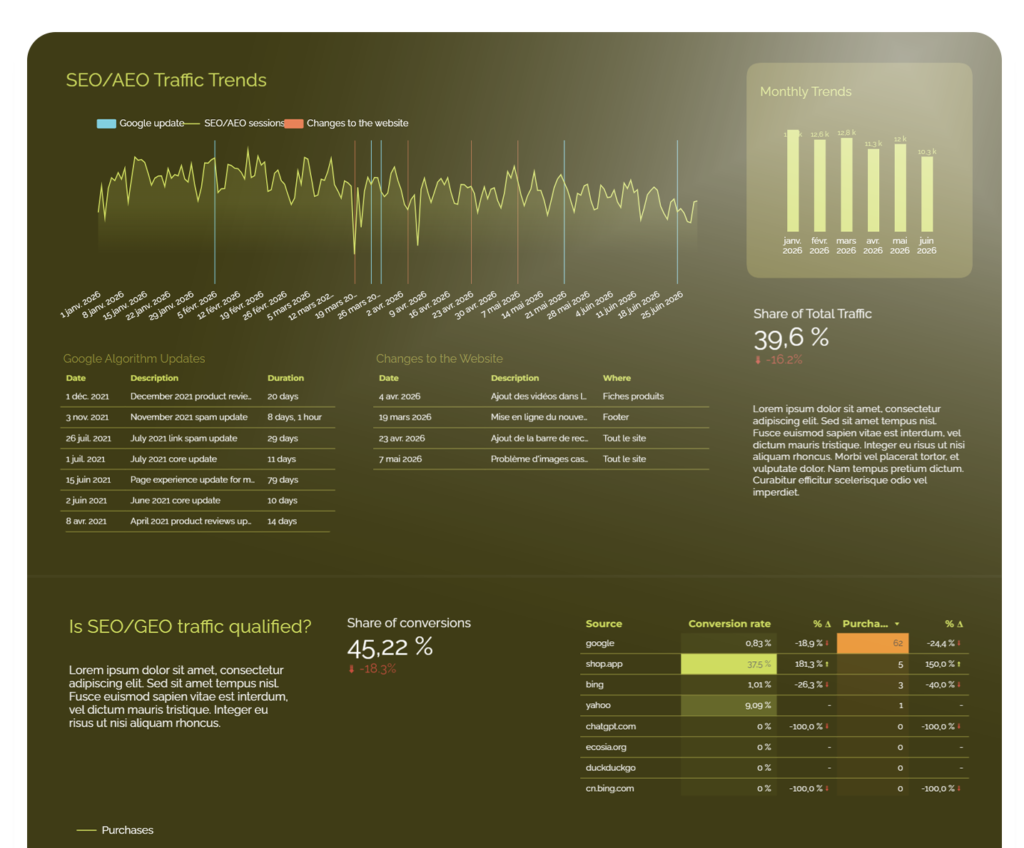
Visualize the evolution of SEO and GEO traffic as changes are made to the site and Google algorithm updates are implemented.
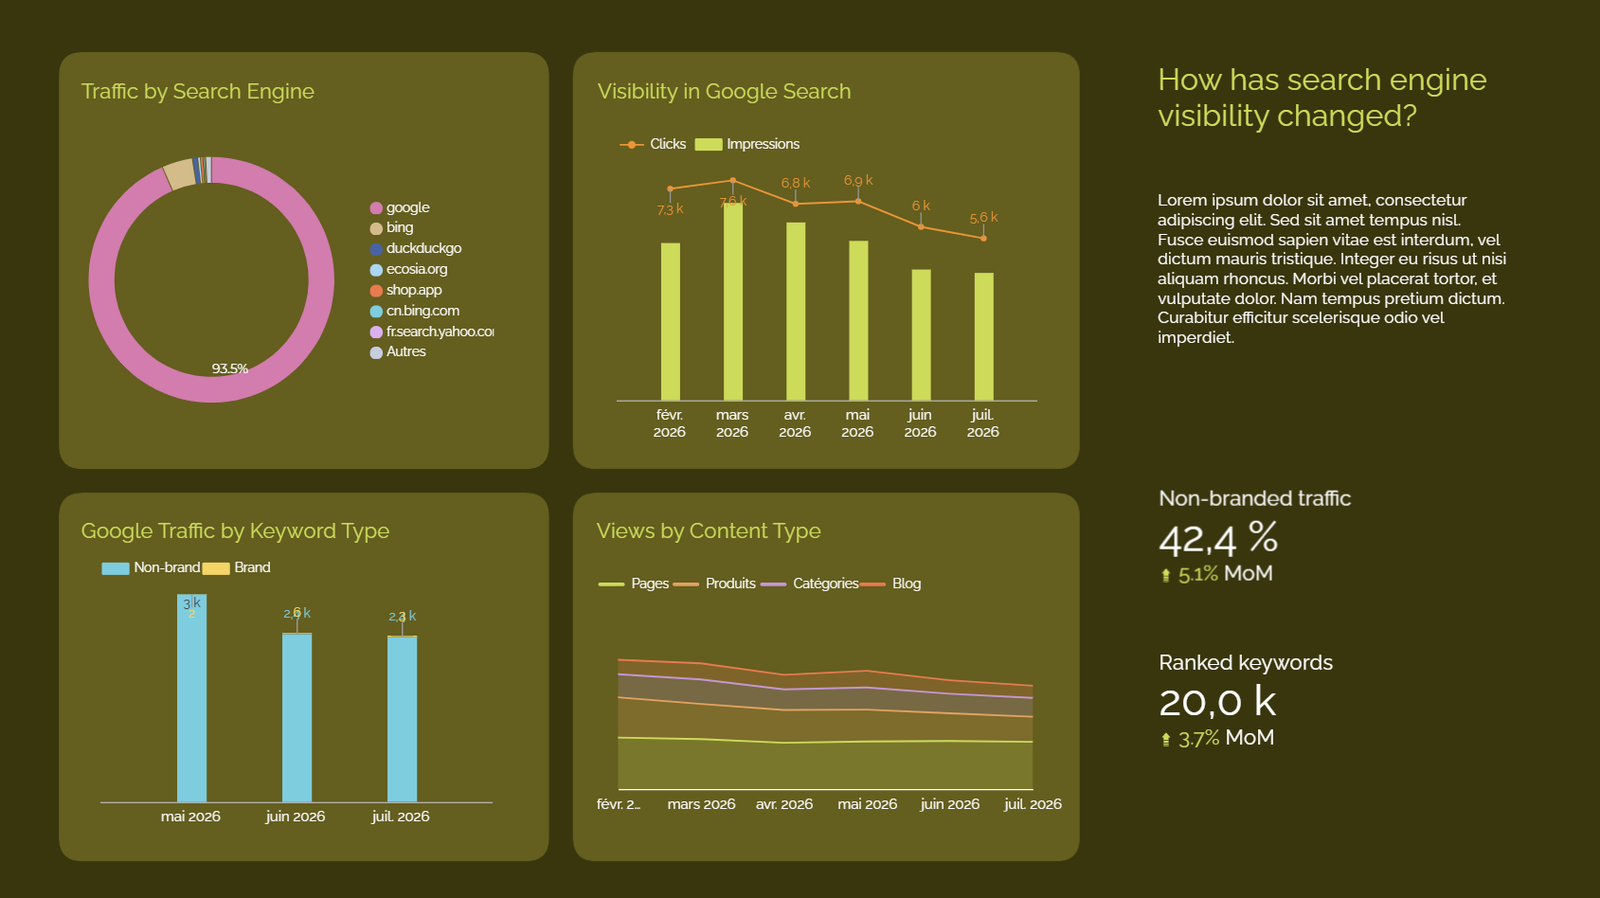
eKjotCXDrS

Page 4 – SEO Visibility

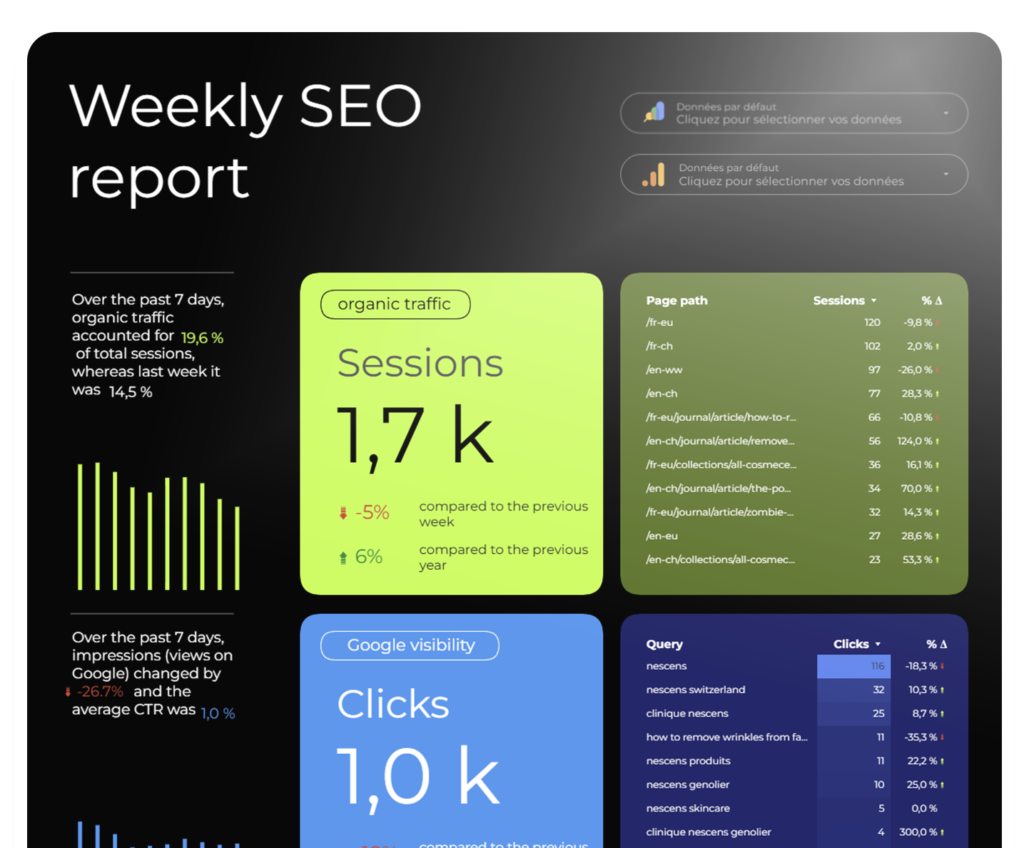
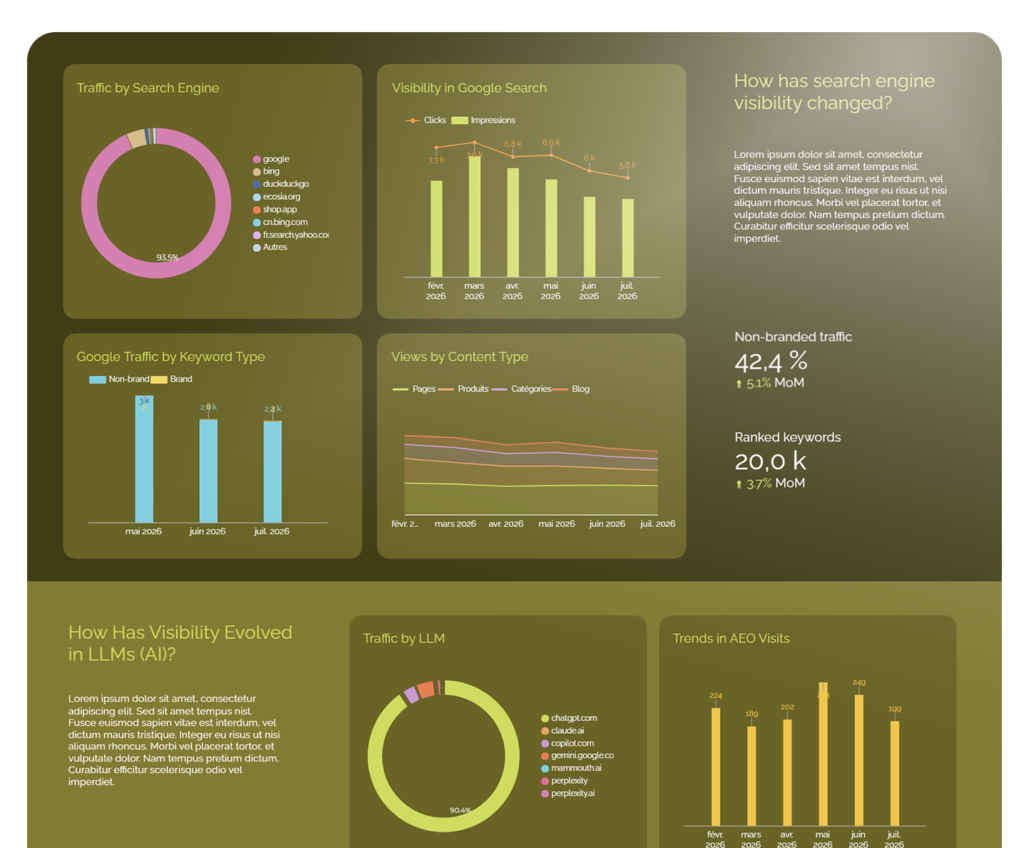
Monitor the site’s visibility on search engines, particularly Google, through the truly important KPIs.
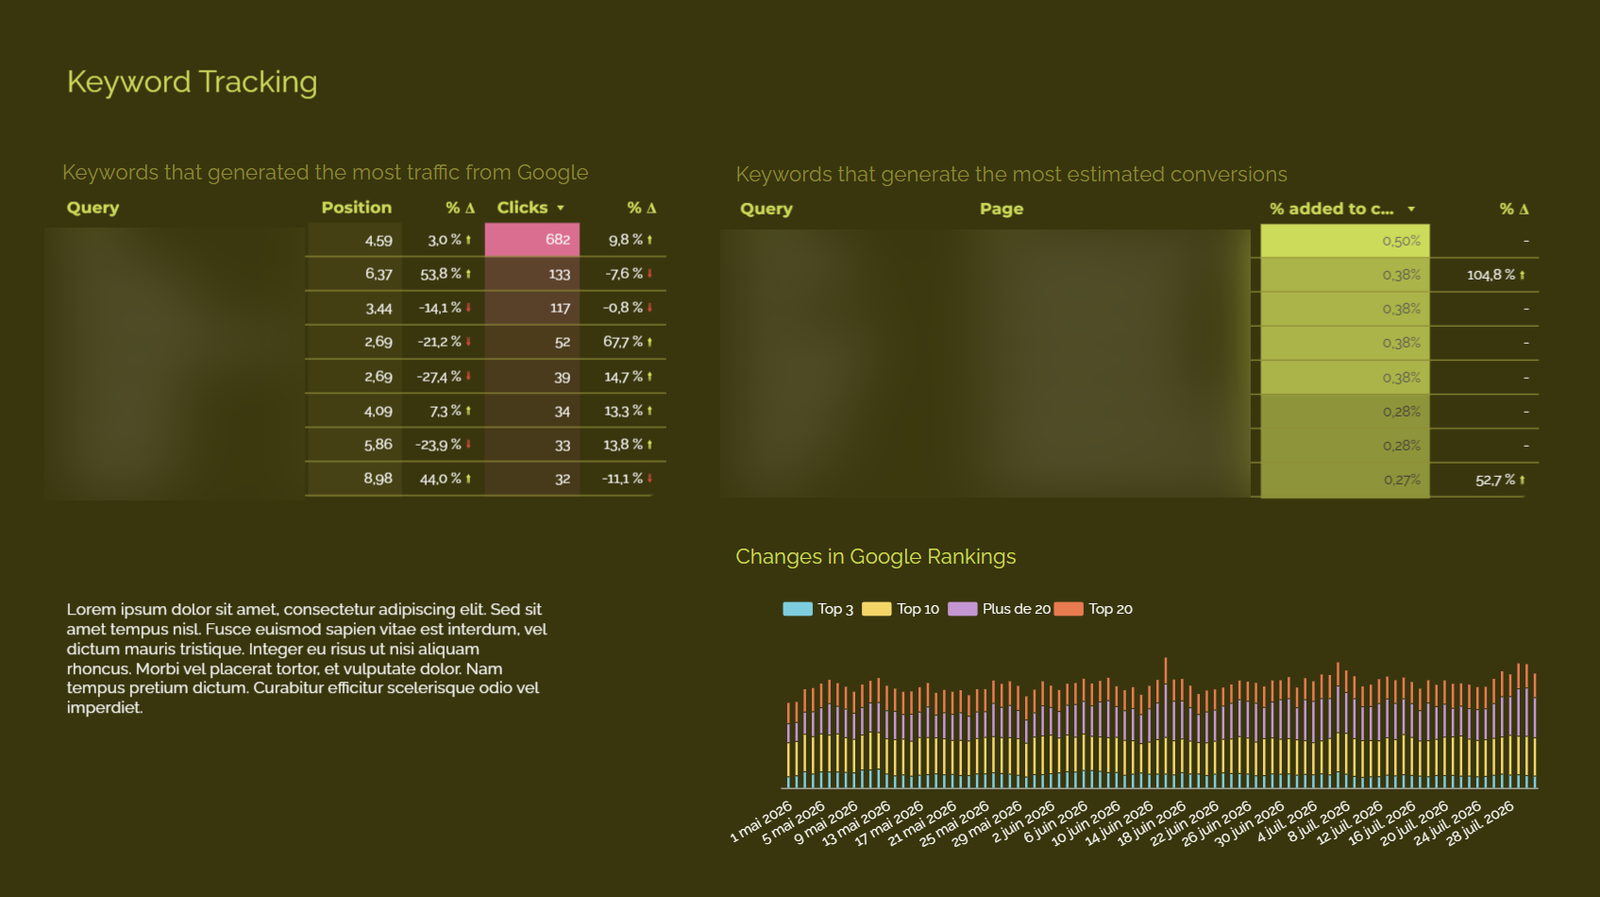
MLW6neEDD3

Page 5 – Keywords

Here you will find the top keywords on Google, the distribution of positions, and an estimate of the most profitable keywords.
VYeNgIIyvs

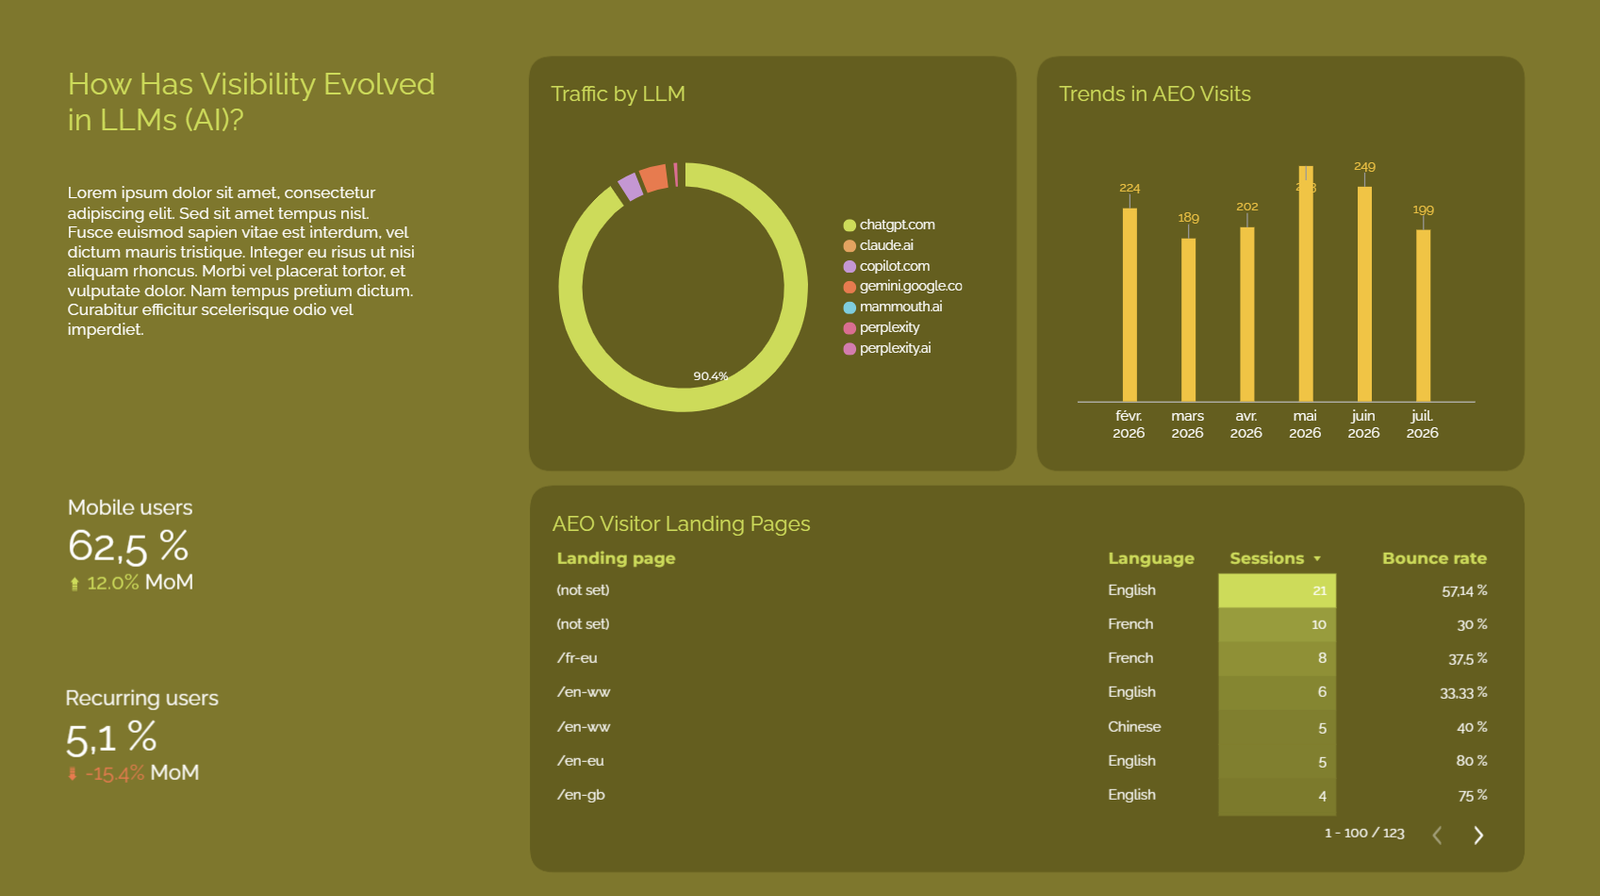
Page 6 – AEO Visibility

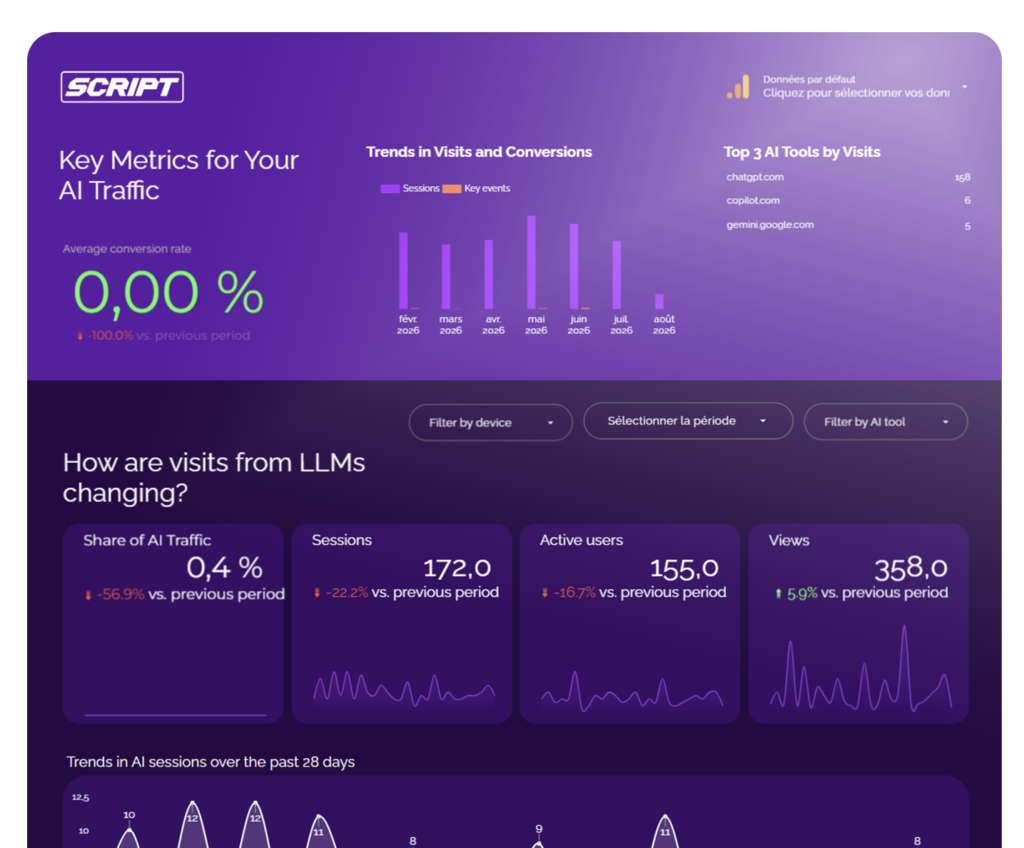
Access an overview of AEO (AI) traffic in an automated manner via GA4.
ohFDO6M46z

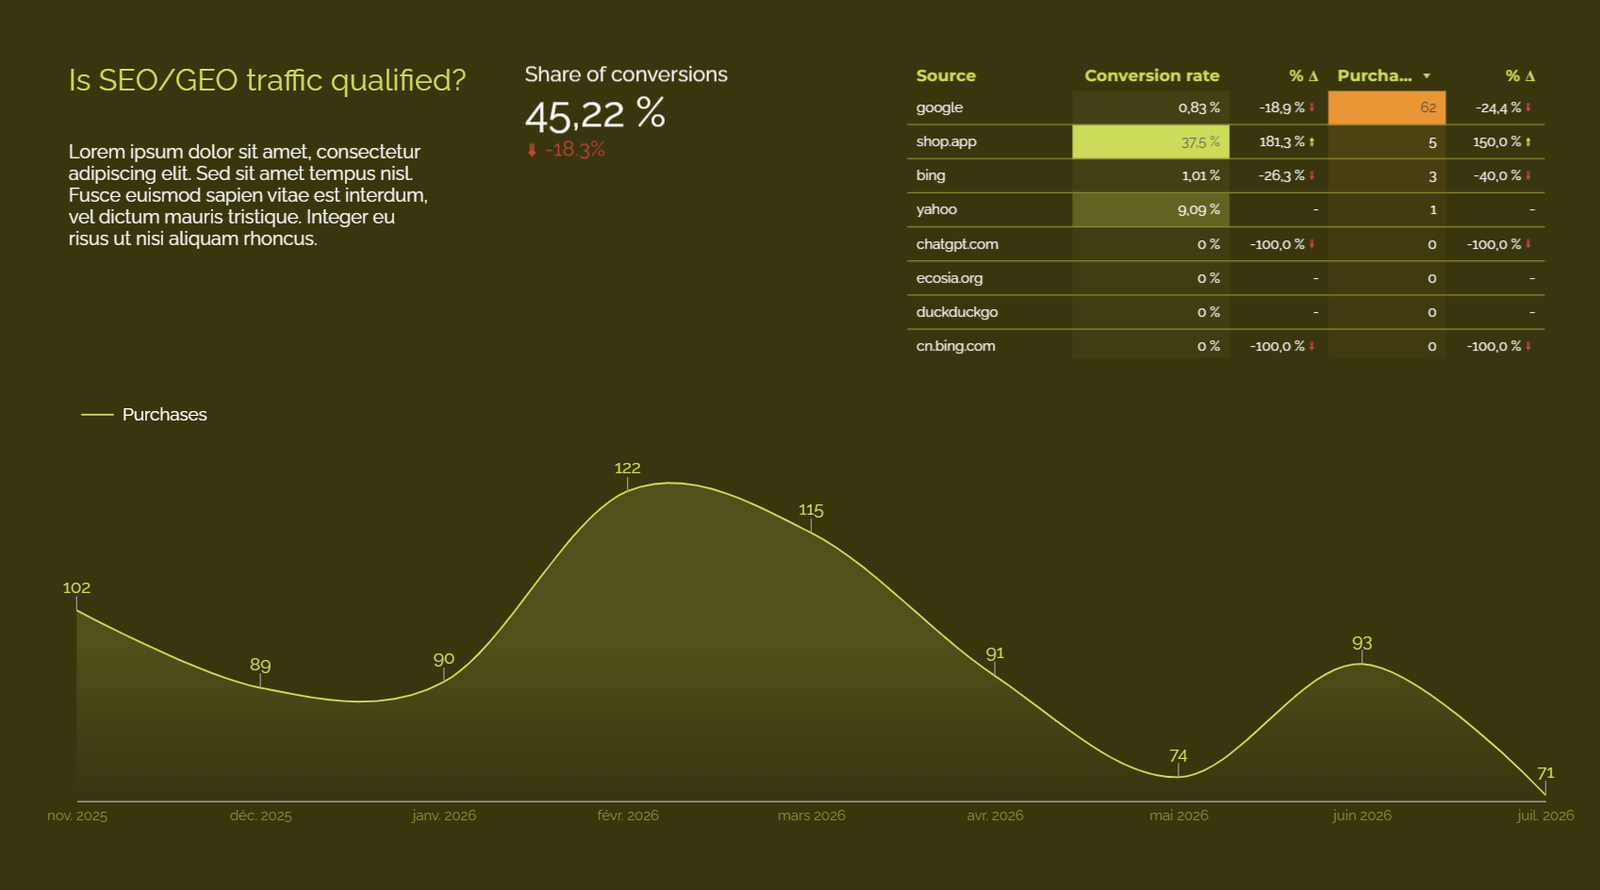
Page 7 – Traffic Quality

Show your client or management the quality of SEO and AEO traffic through its weight in revenue.
zilkfZdAaH

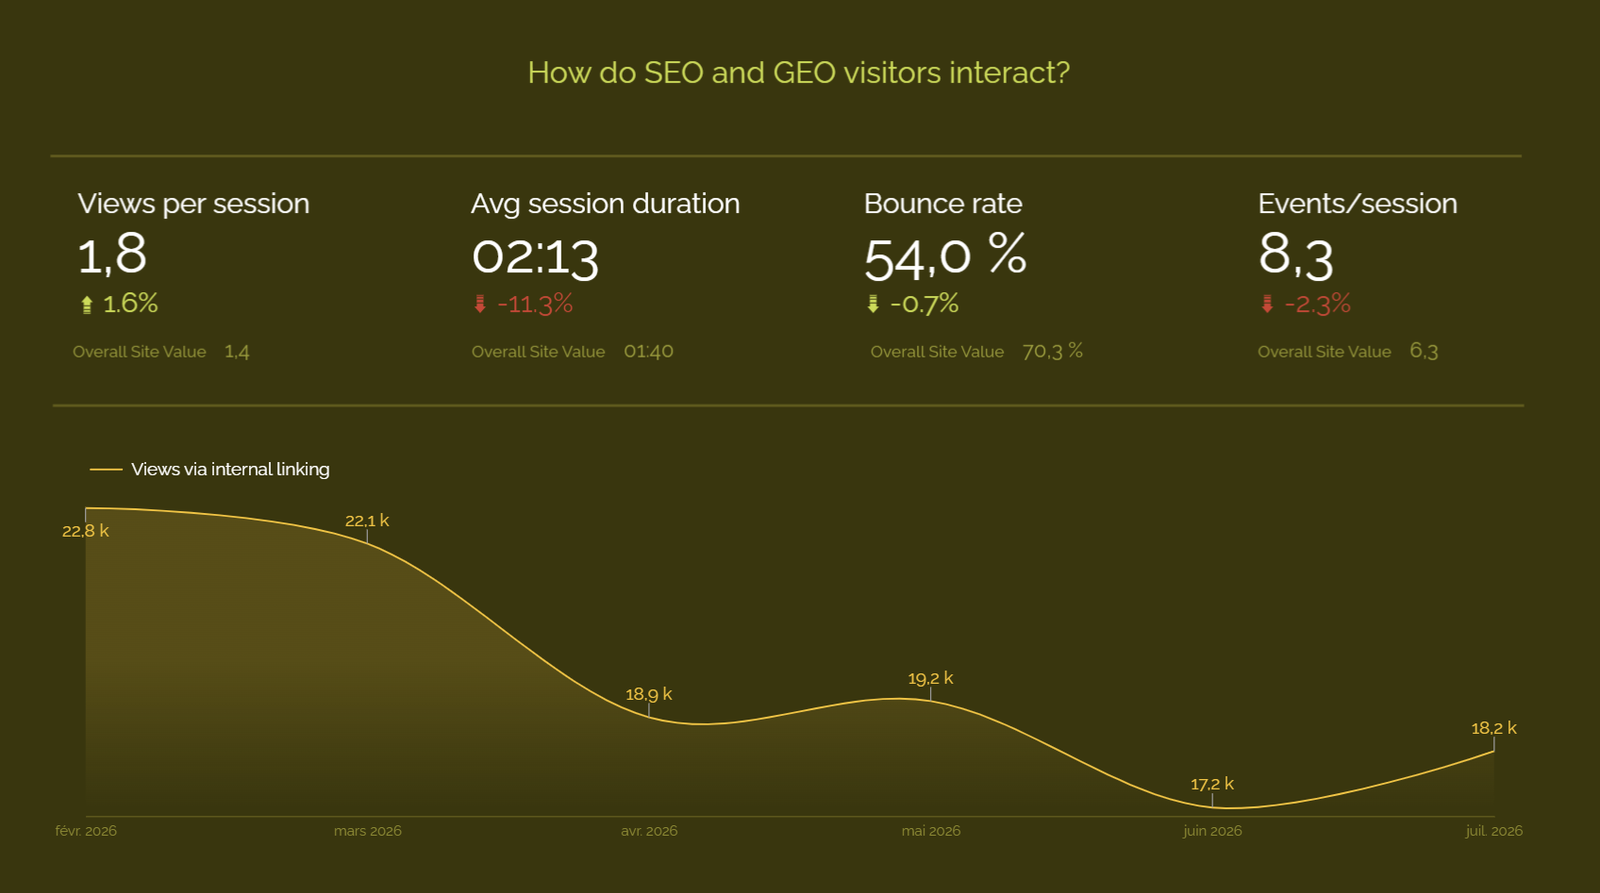
Page 8 – Interactions

Also monitor whether user signals are positive (an essential factor for SEO).
nij4CoQ3Nz

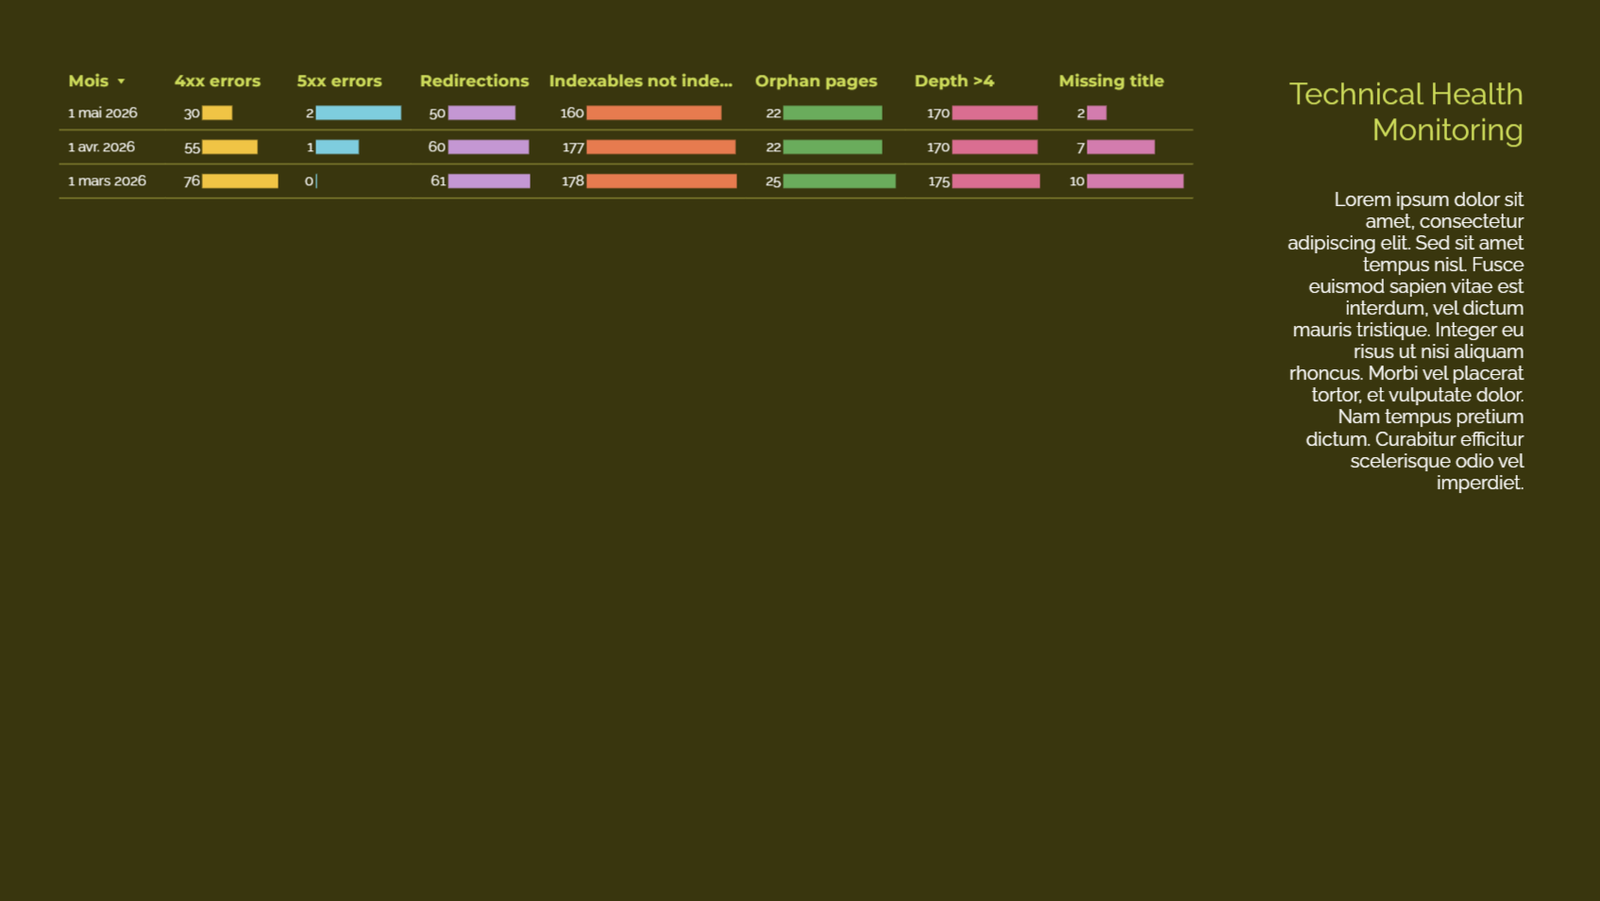
Page 9 – Technical Health

Monitor the site’s technical health over the months. This data must be entered manually into the Google Sheets file.
4nIXMKLOTb

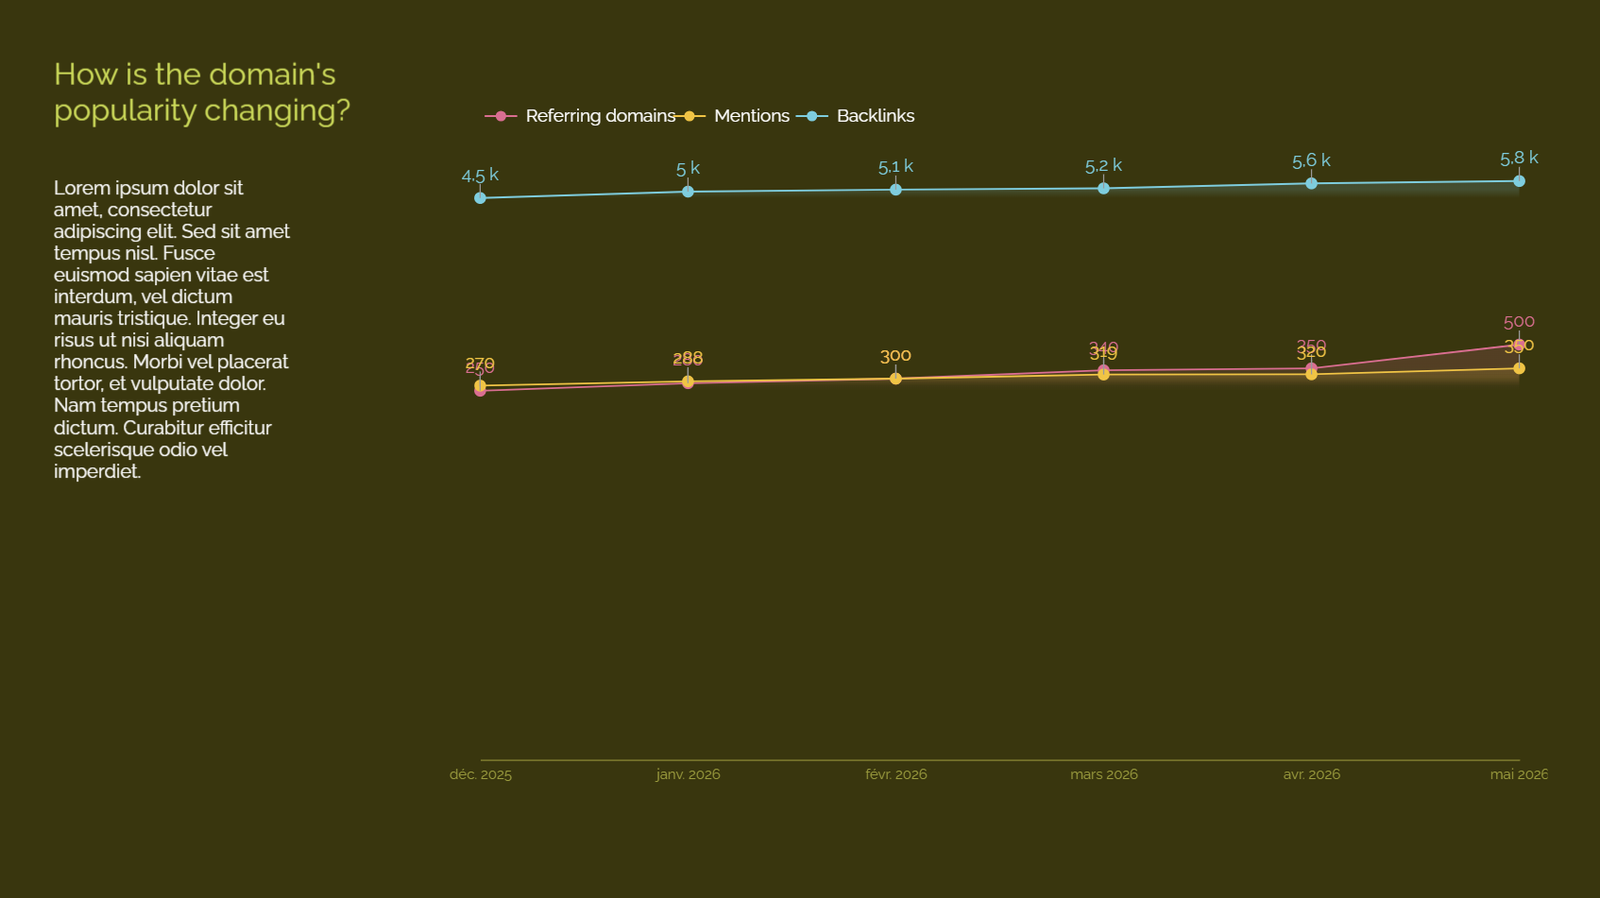
Page 10 – Popularity

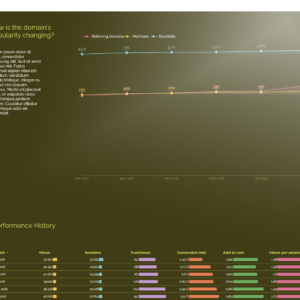
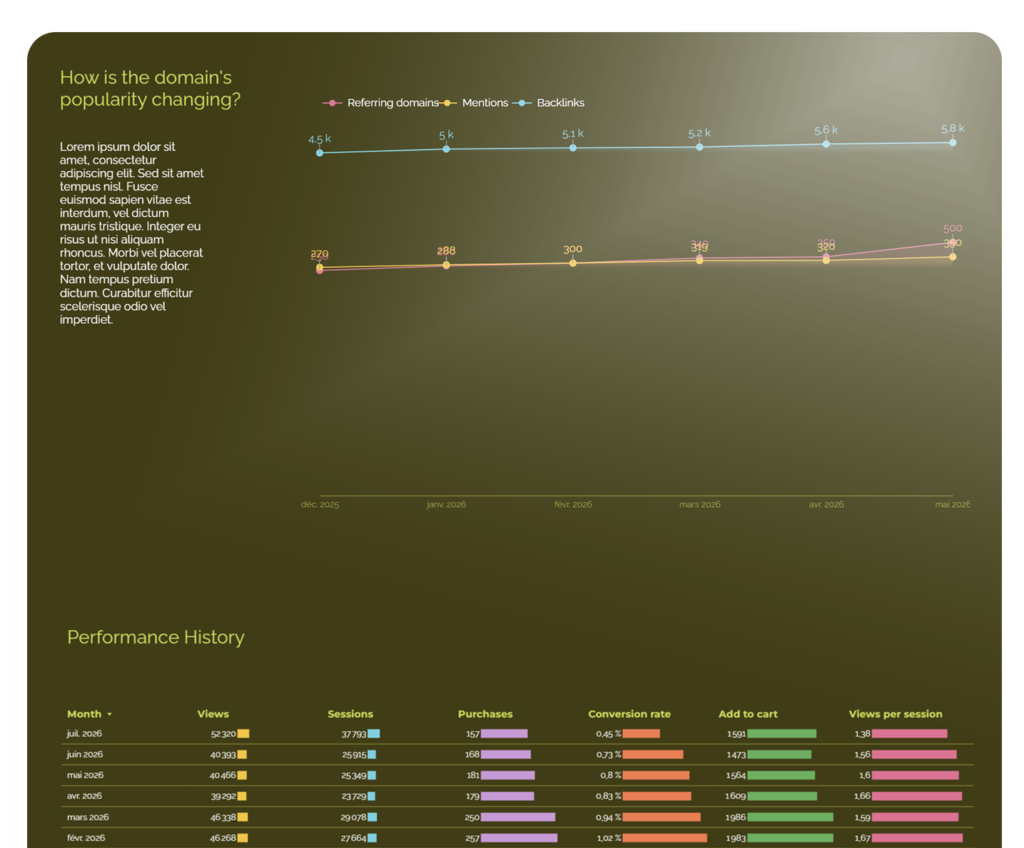
Track the evolution of domain authority (backlinks) and the number of brand mentions on the web (to be filled in manually).
Rm7gIC0PyO

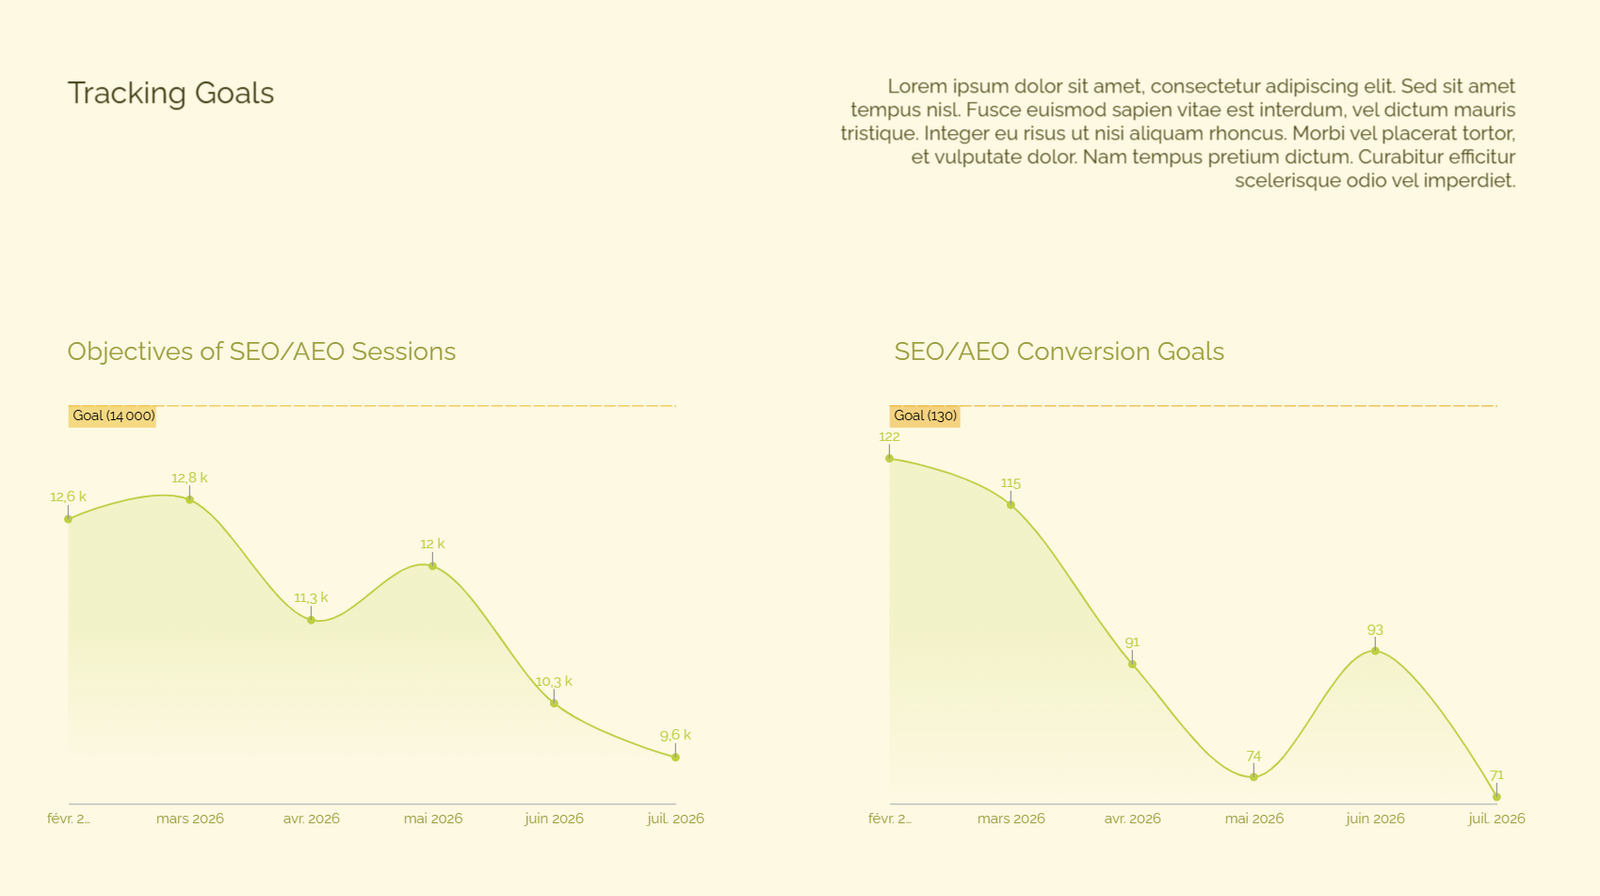
Page 11 – Objectives

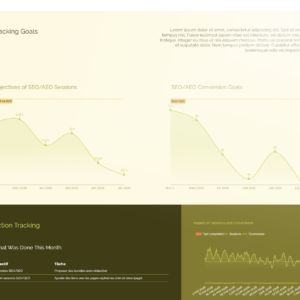
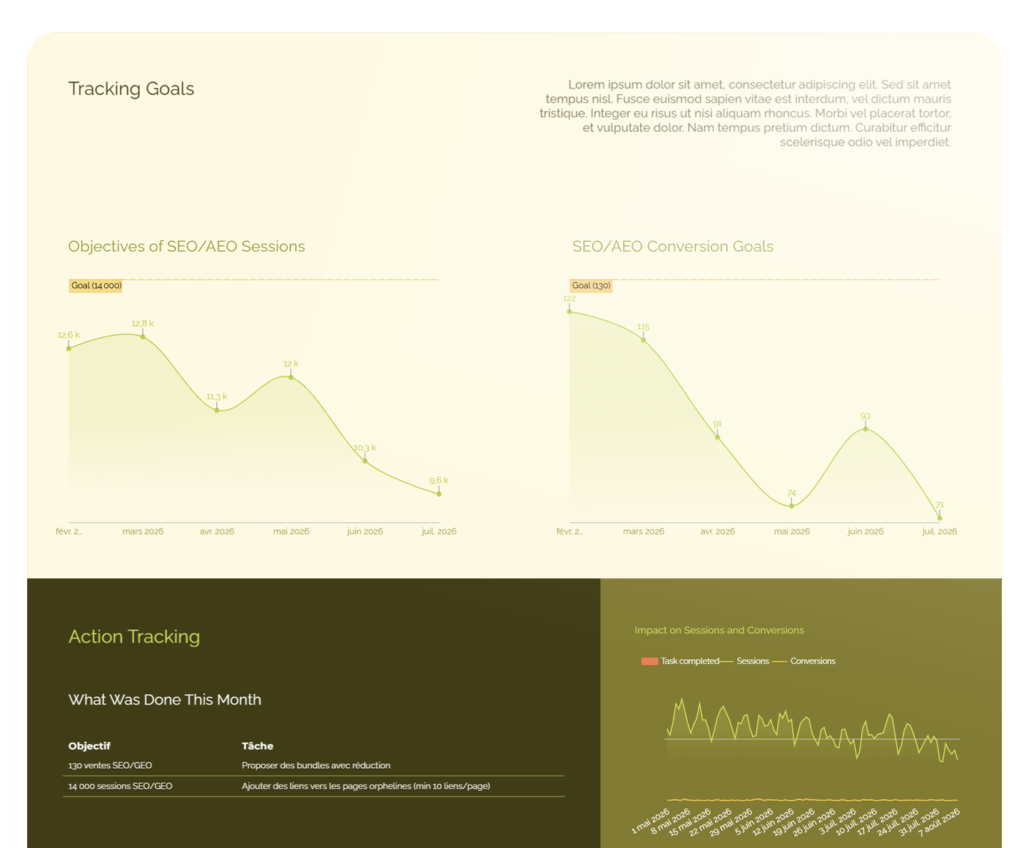
Show your client or management that the set objectives will soon be achieved with clear and automated charts.
qnnE6T35bC

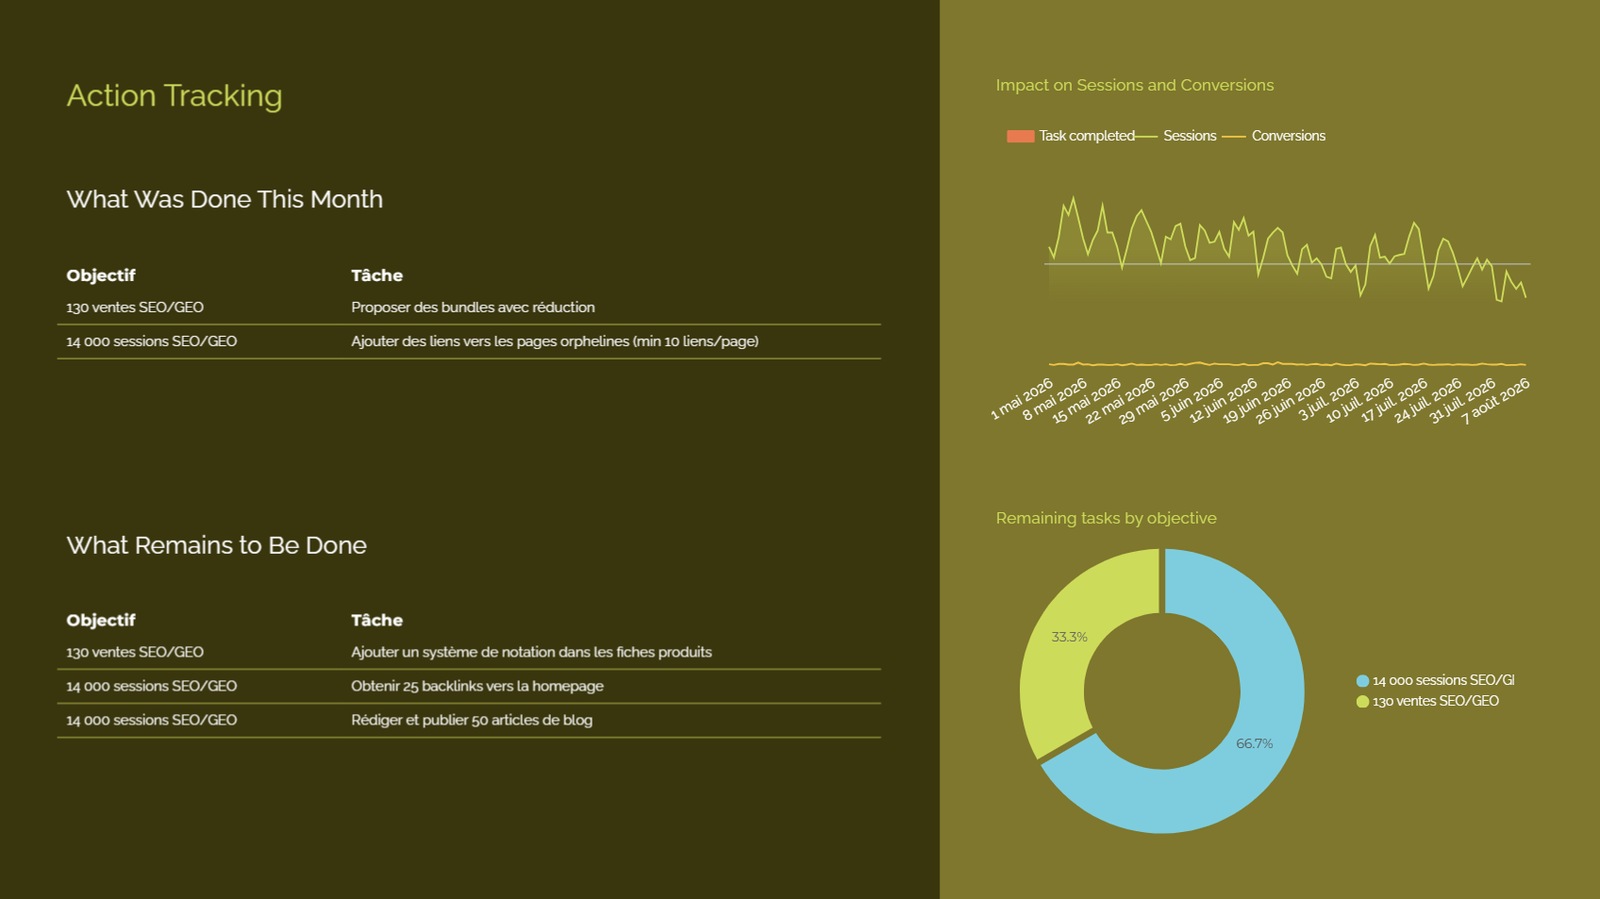
Page 12 – Actions

Use a single file for your goals and tasks; the reporting will take care of presenting them in a way that shows their impact.
VtvWNBZojn

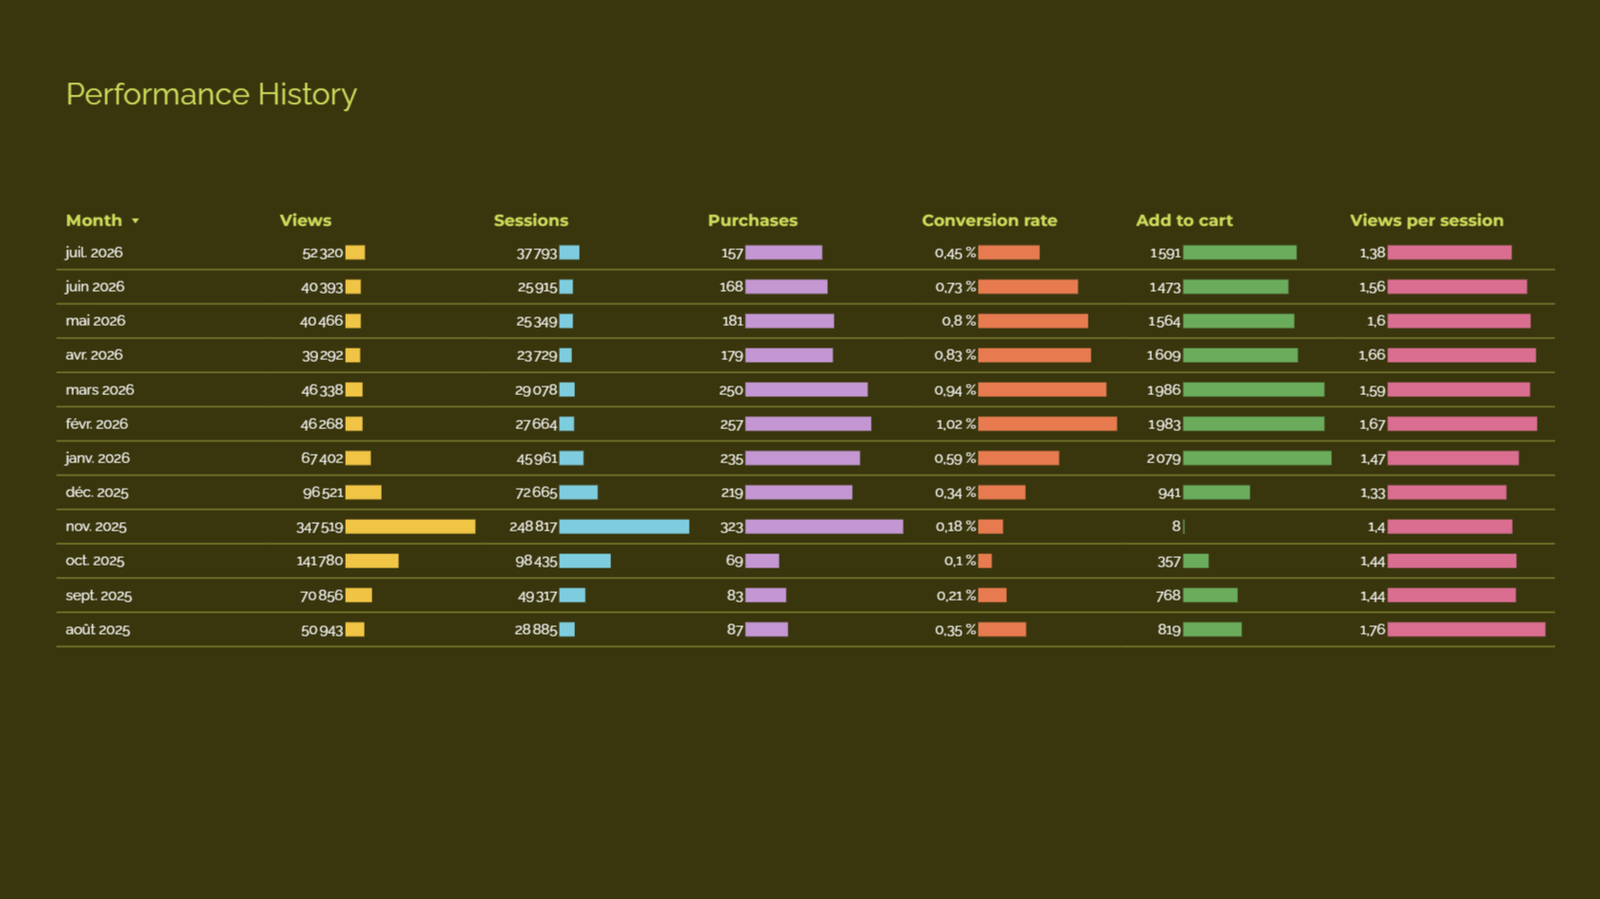
Page 13 – History

This graph allows you to see the evolution of performance month after month and to demonstrate the effectiveness of your strategy.
3ay1UaMDI0

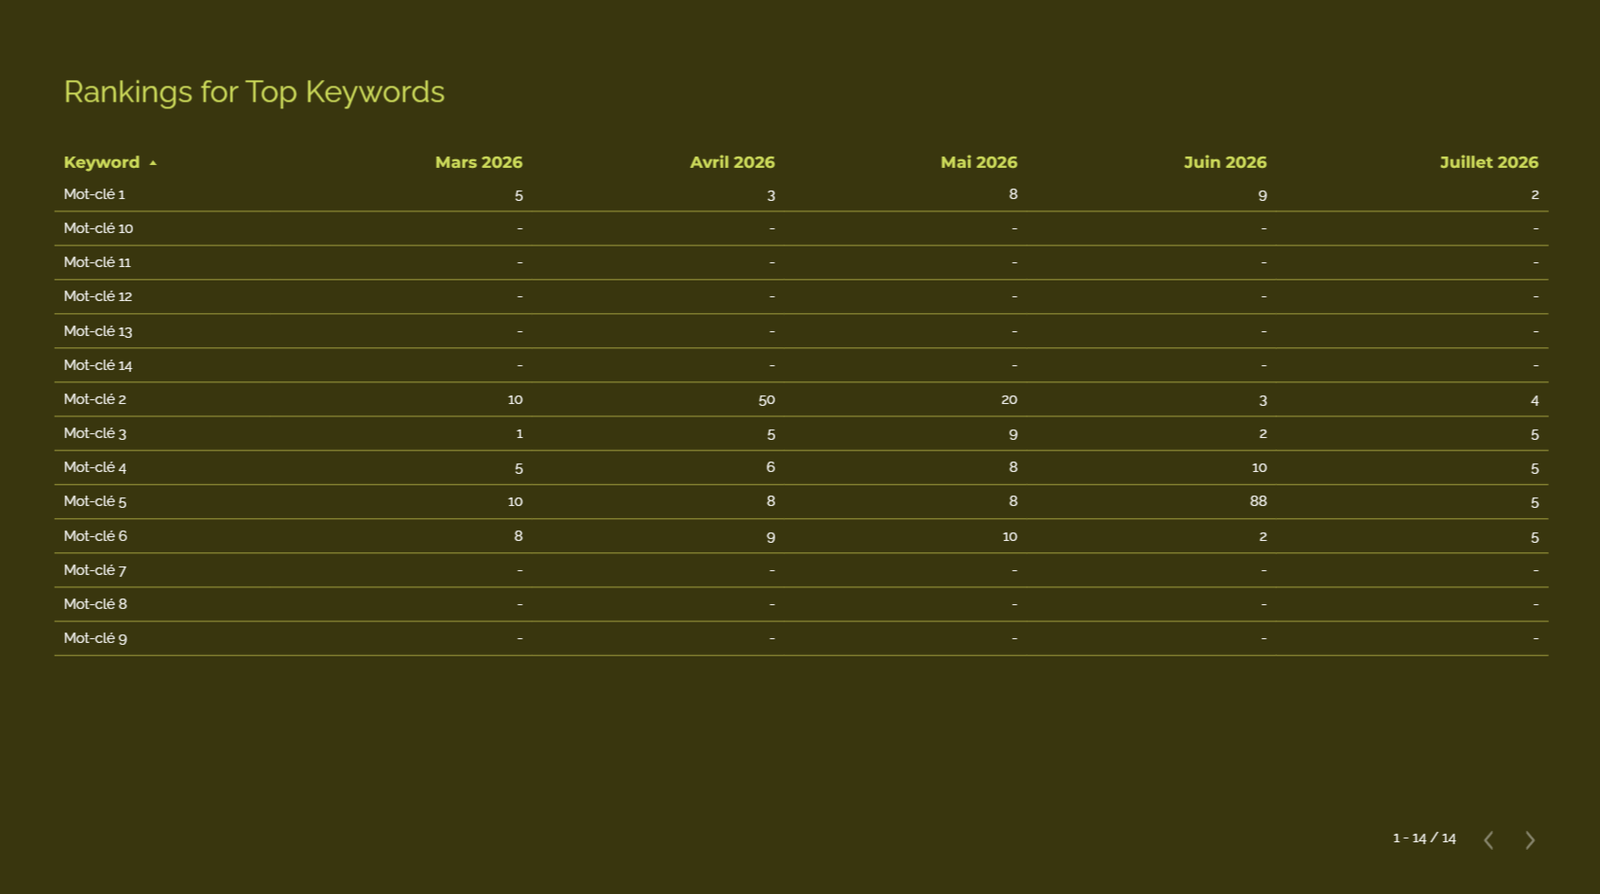
Page 14 – Positions

Finally, your client/management can view all positions on the most strategic keywords over the months.

For whom

Freelance SEO/GEO consultants who manage multiple clients and want to produce professional reports without spending all week on it
Marketing agencies that need standardized reporting, replicable from one client to another, without sacrificing personalization
In-house SEO teams that must report to management and prove the profitability of the organic channel in business figures

His advantage

Most SEO reports are data exports, not decision-making documents. Rush’s structure is designed to answer the only question that matters to the client: “Is it progressing, and is it generating revenue?” The rest of the report is there to 
demonstrate the correlation between actions and results.

The other structural difference is 
the native integration of GEO . While competing tools still ignore visibility in generative AI, Rush measures and tracks it automatically. By the time your customers start asking the question, you already have the answer.

What you get
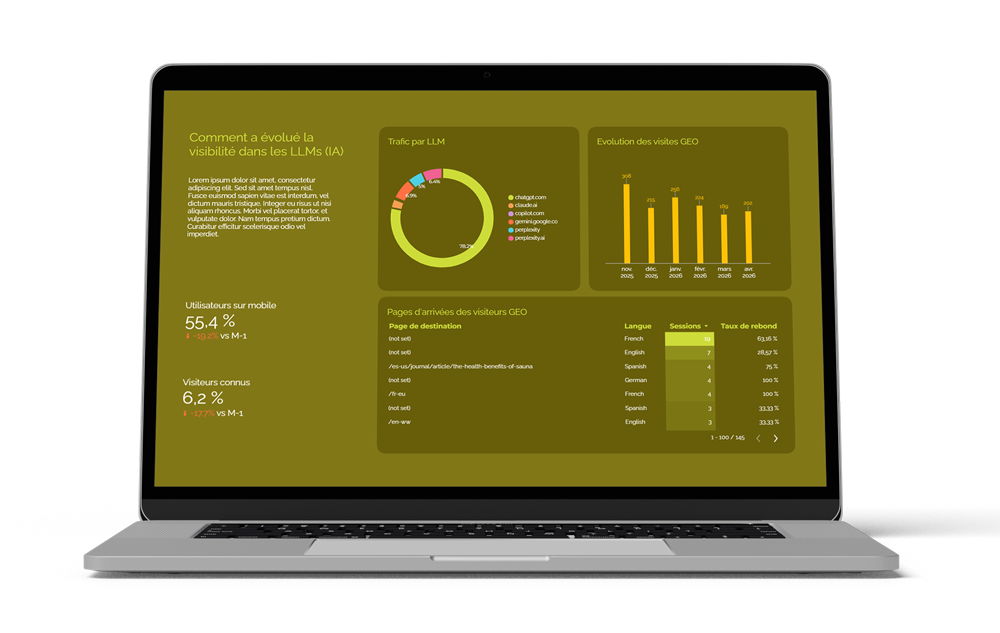
template data studio reporting SEO Rush

The Data Studio template to duplicate
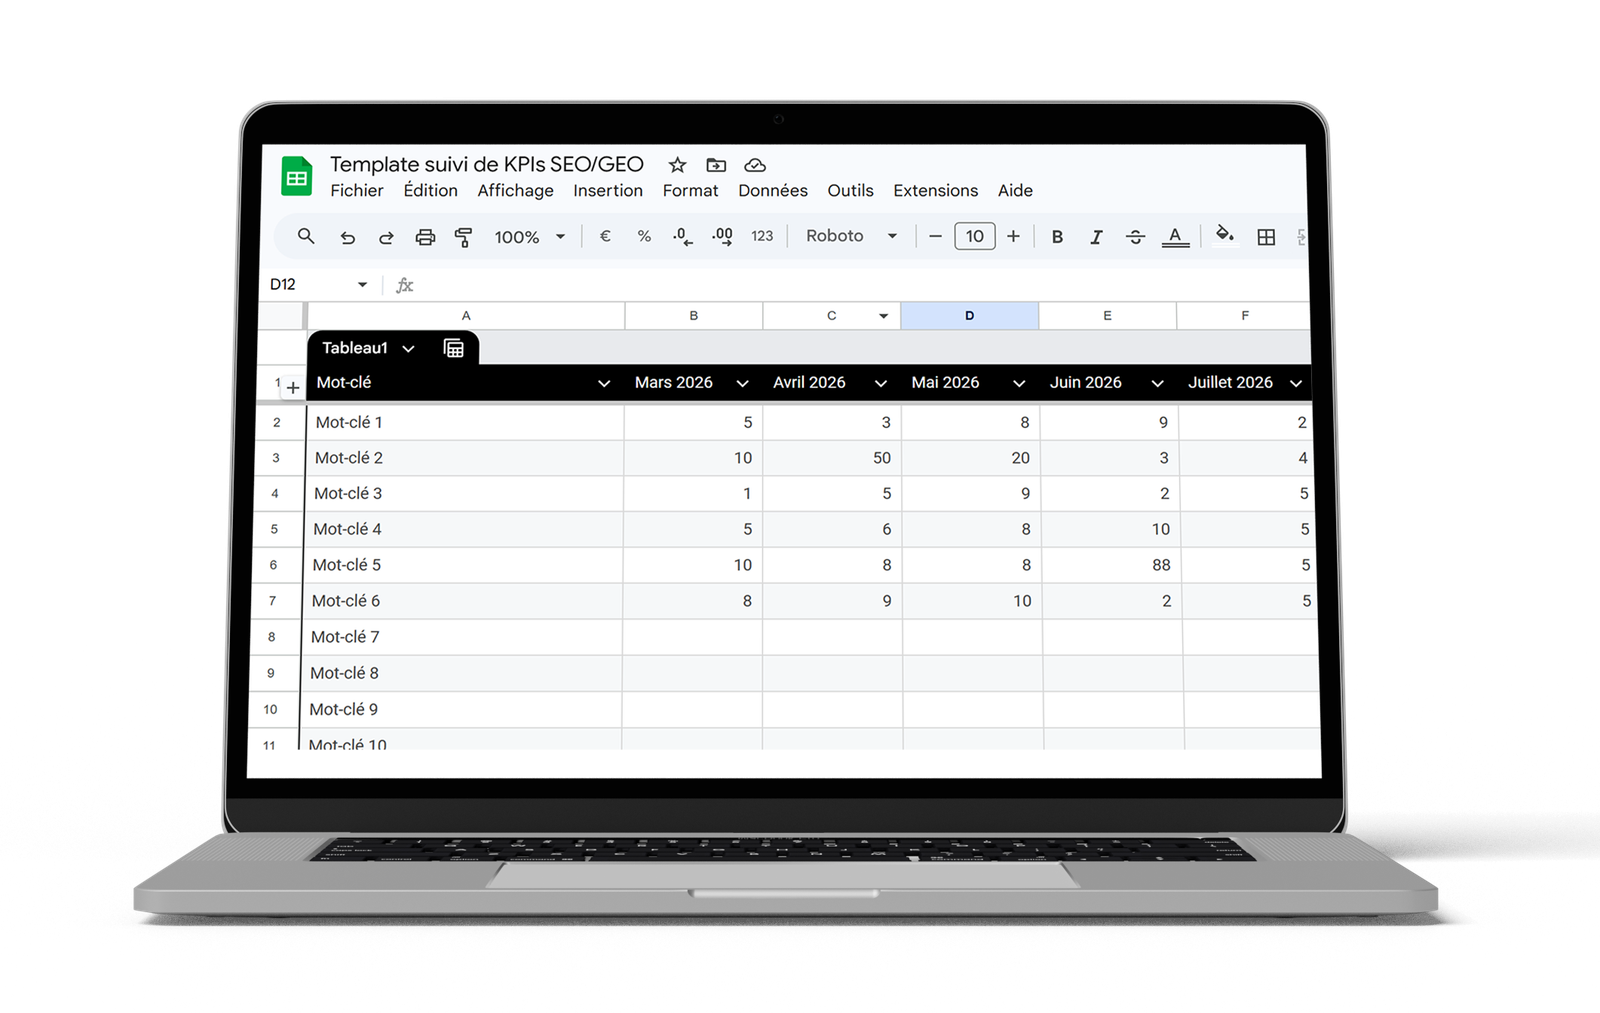
fichier de suivi KPIs SEO / GEO

The GSheets file for filling in non-automated data
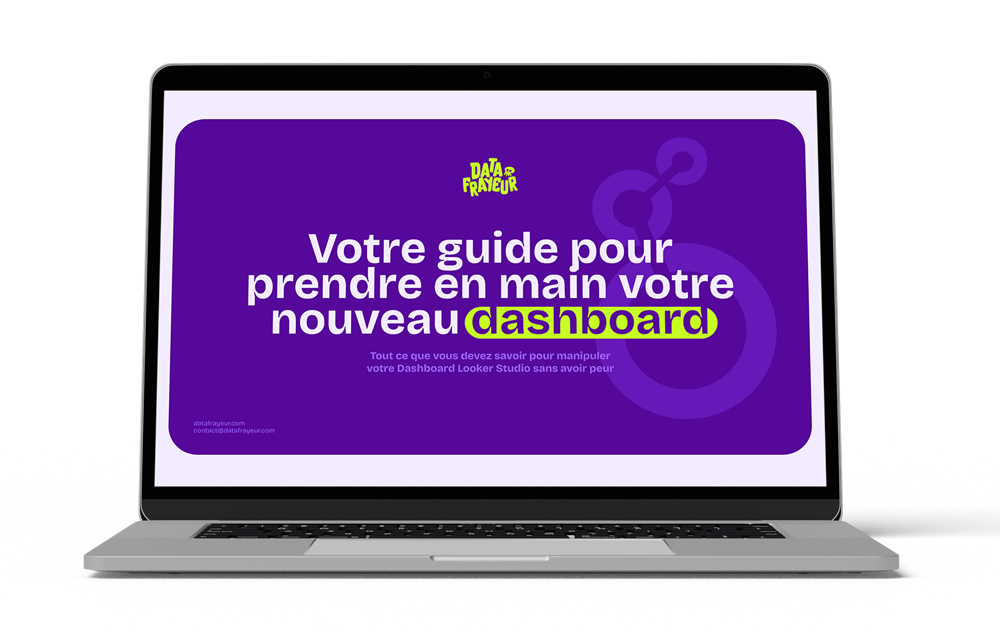
mockup doc technique

Technical documentation for getting started
guide OKR pour le SEO

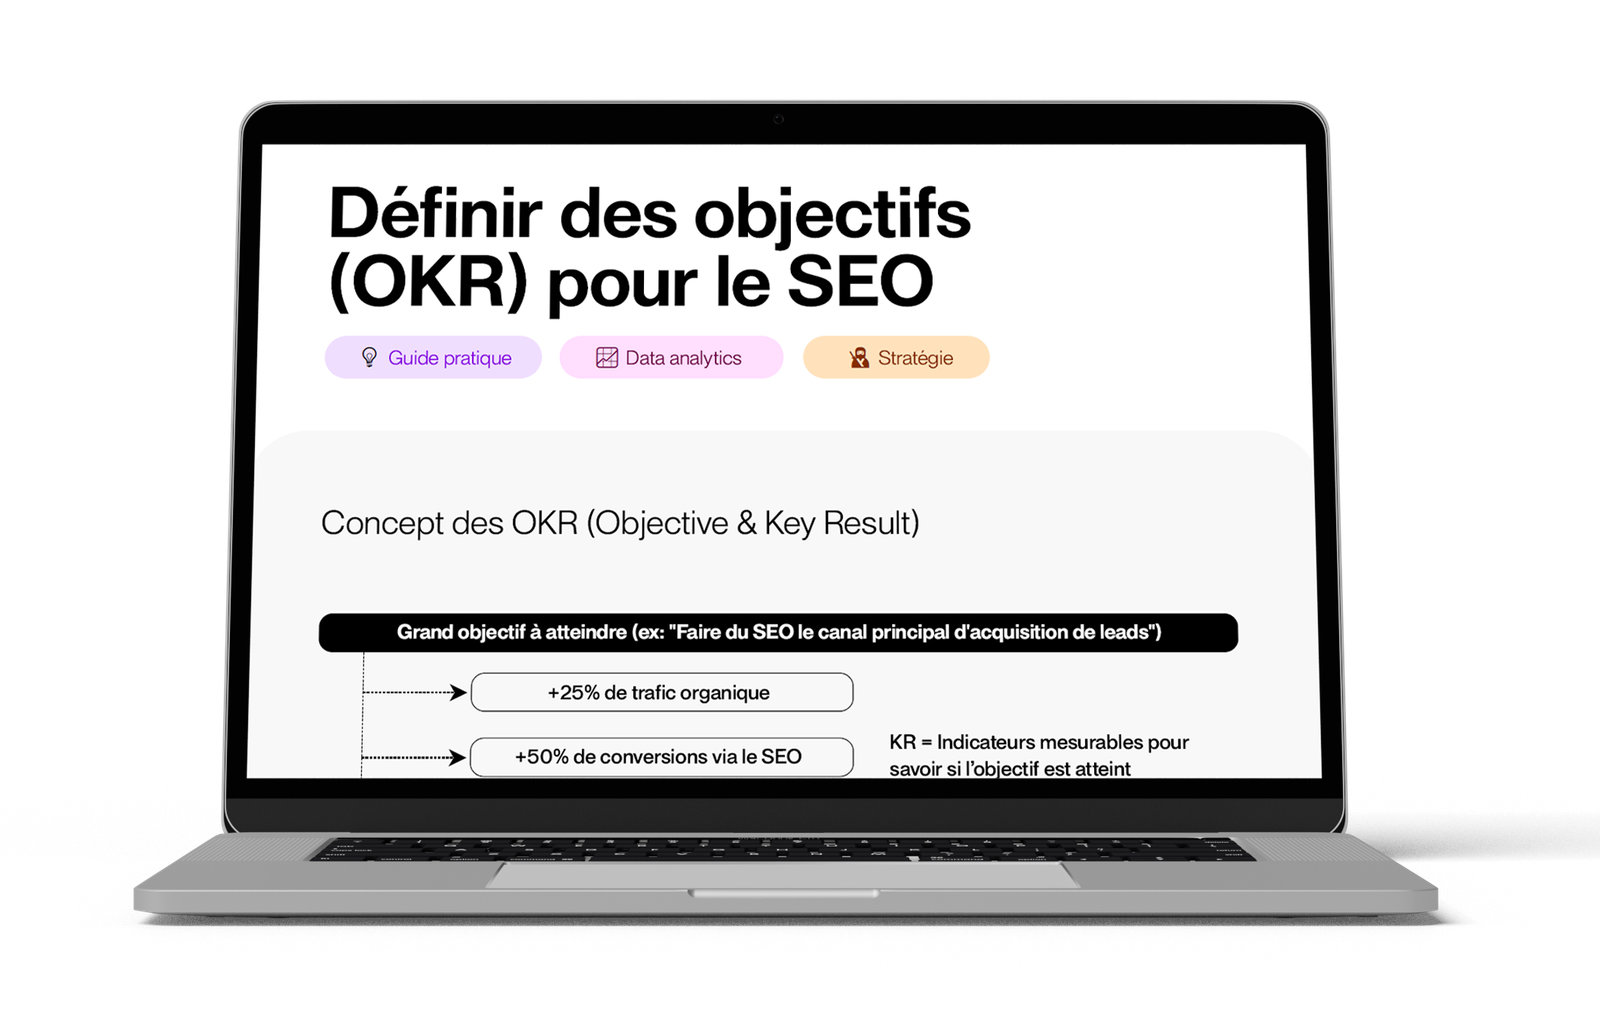
How to use OKRs in SEO

There are no reviews yet.

Be the first to review “Rush : Monthly SEO & AEO Report – Data Studio”

Your email address will not be published. Required fields are marked *

Vous aimerez aussi…