


Data sources

Google Search Console

Google Sheets
Google Analytics
Metrics
Dimensions
Benefits
Features
Sending automatic reports by email
GSheets file to be filled in with some manual data
White label design
Suitable for an e-commerce or editorial website
Duplicable for site-specific reporting
Easy PDF export
SEO and AEO traffic filters already applied
Weight of SEO/AEO in traffic and revenue
Estimating the keywords that generate the most revenue
Use Cases
Structure
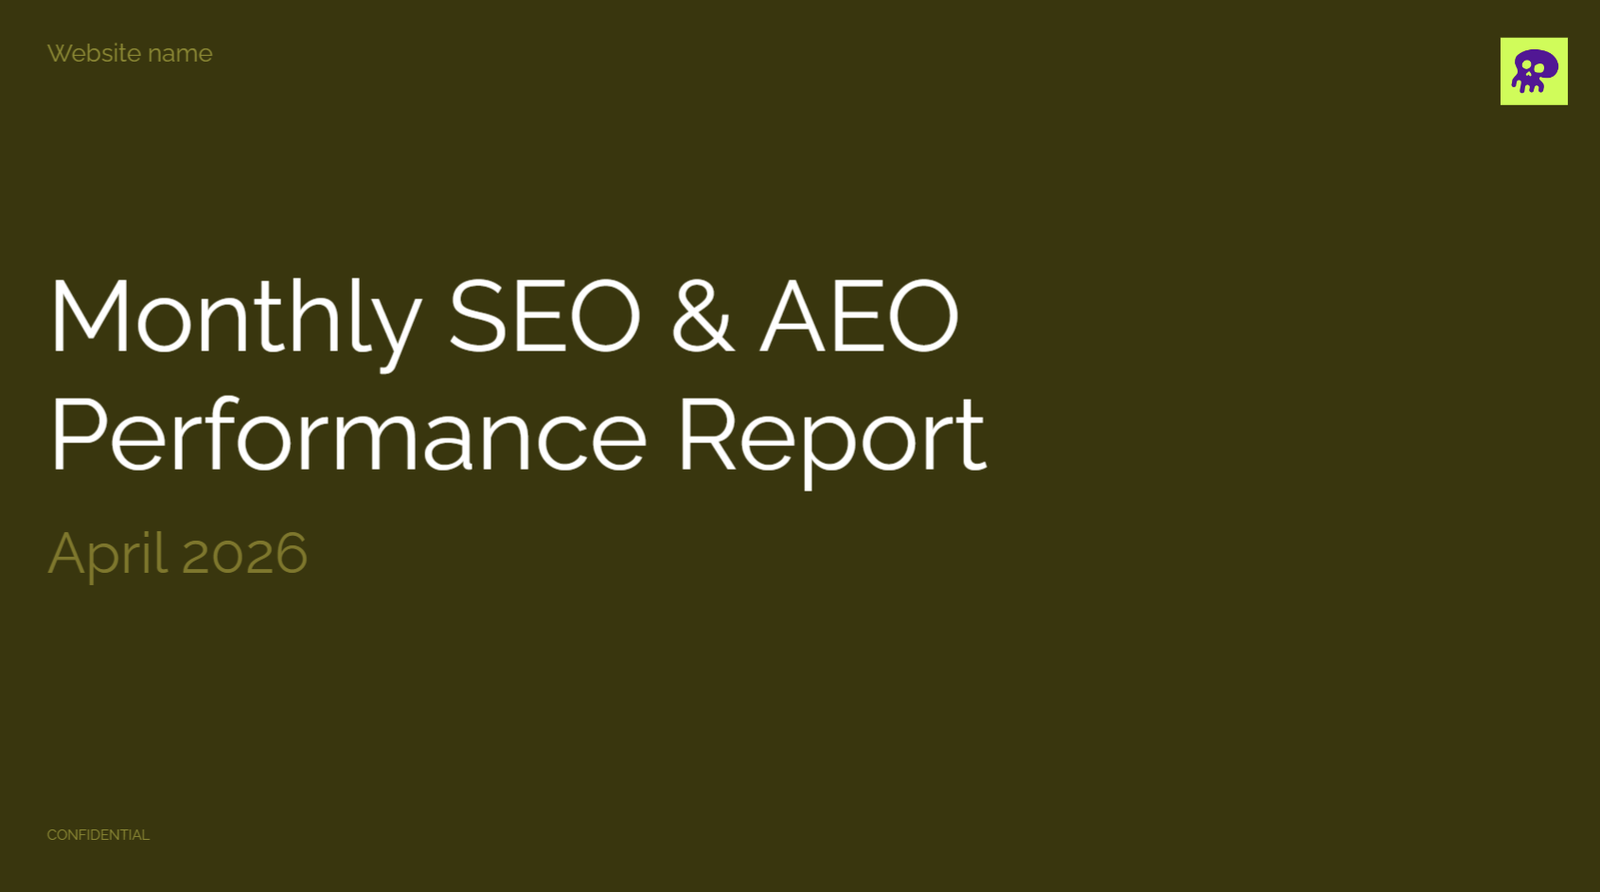
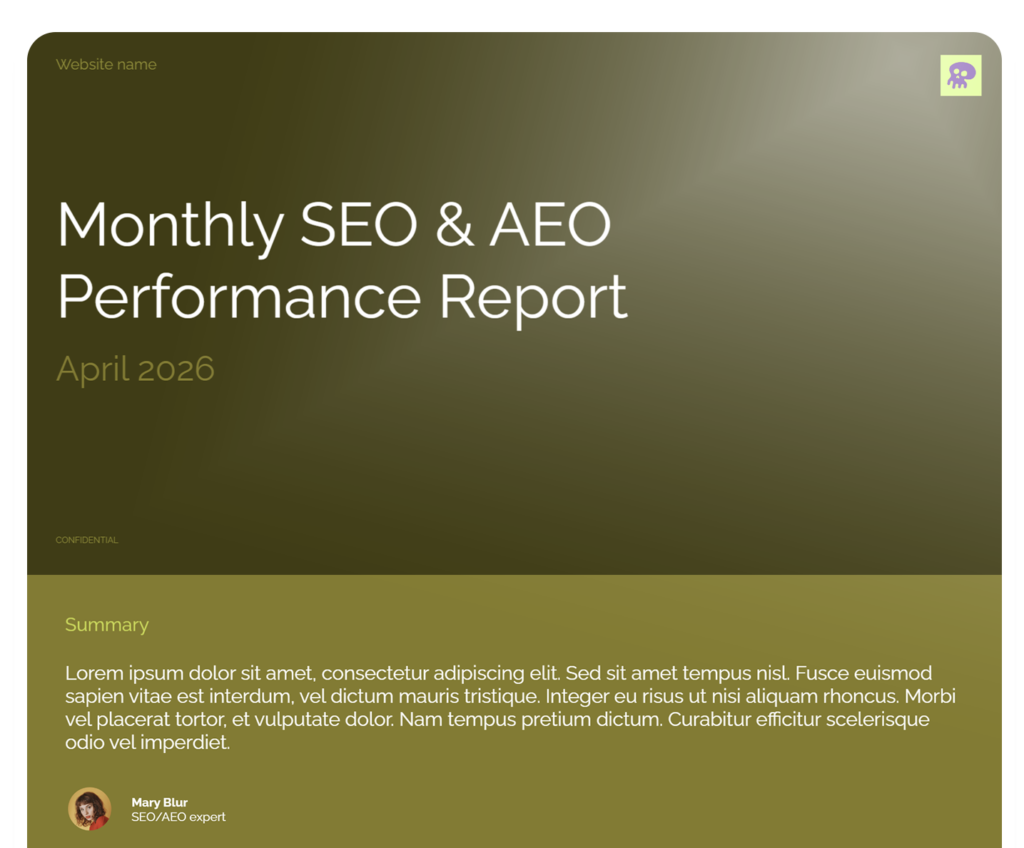
Page 1 – Introduction
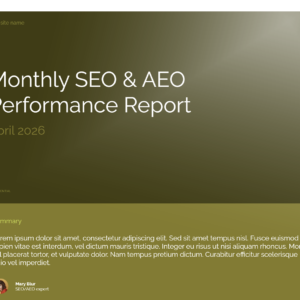
This cover page simply introduces the report, with the title and the name of the company/client.
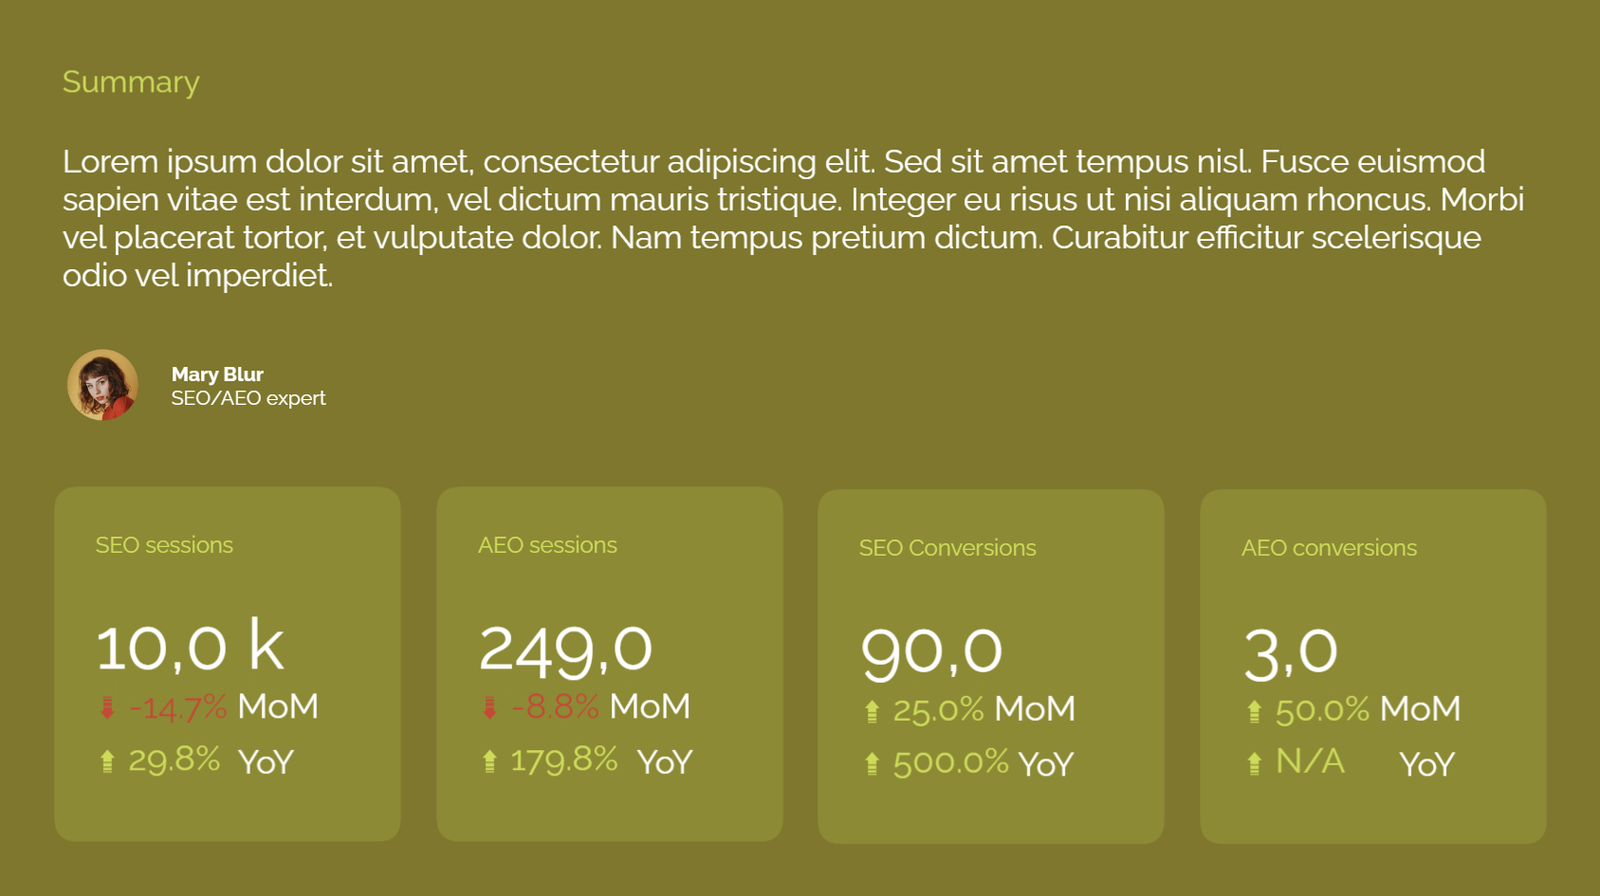
Page 2 – Summary
Here you can add an overall comment on performance and get a quick overview of key figures.
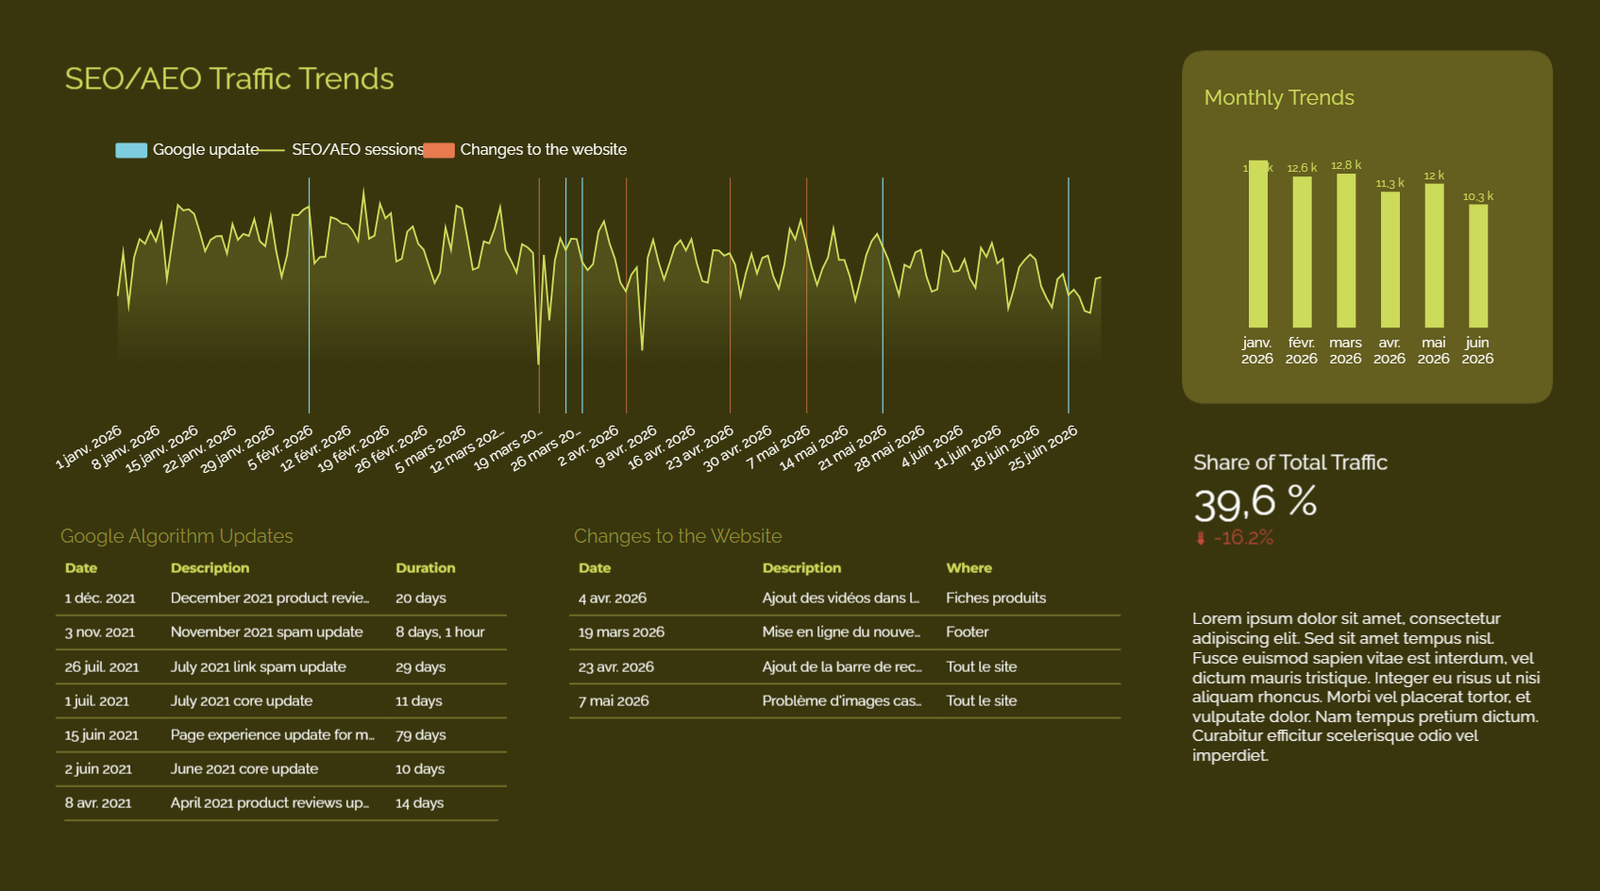
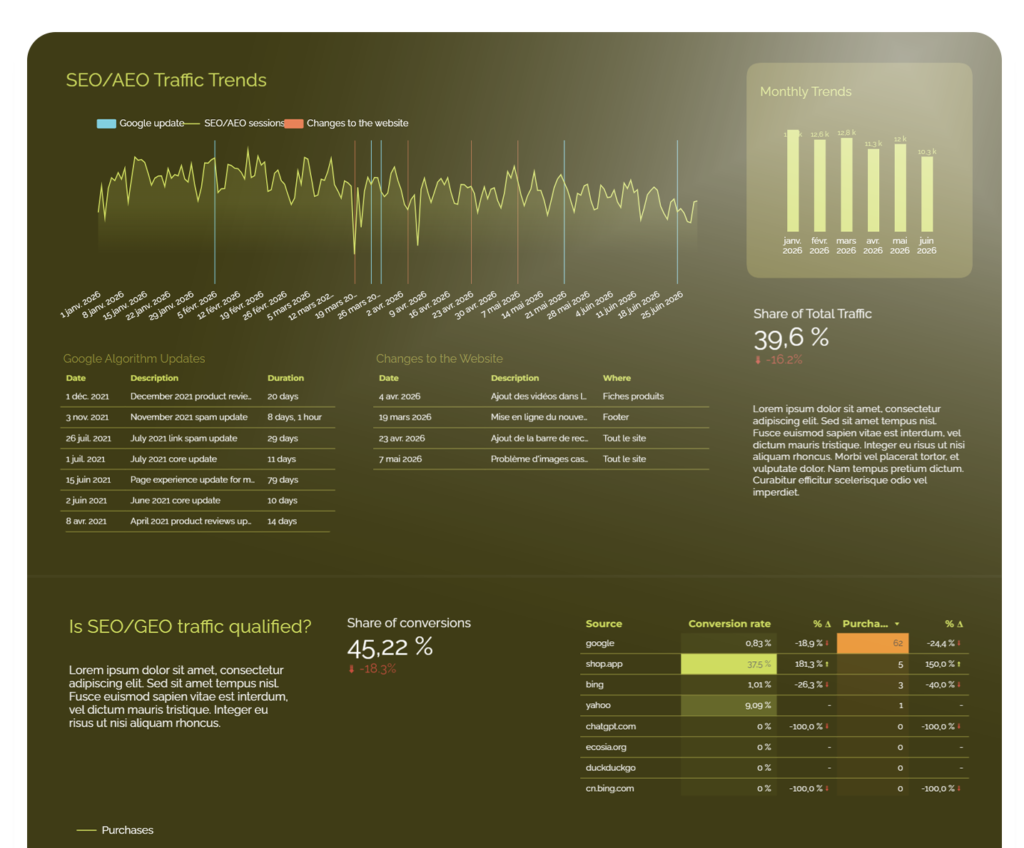
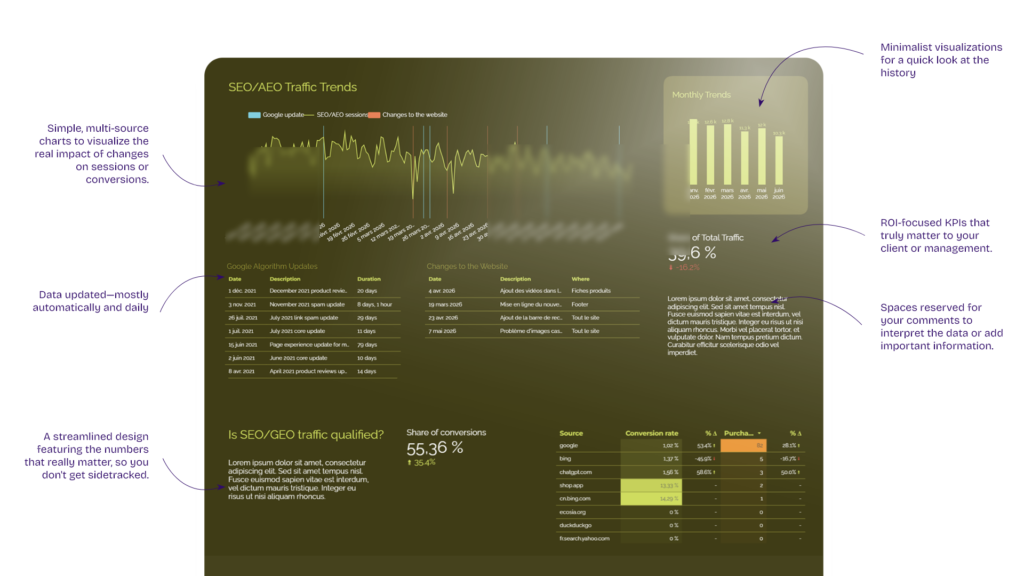
Page 3 – Traffic Trends
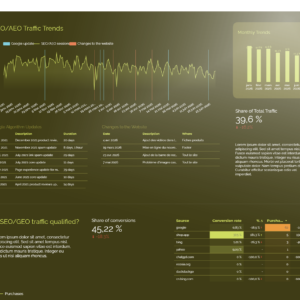
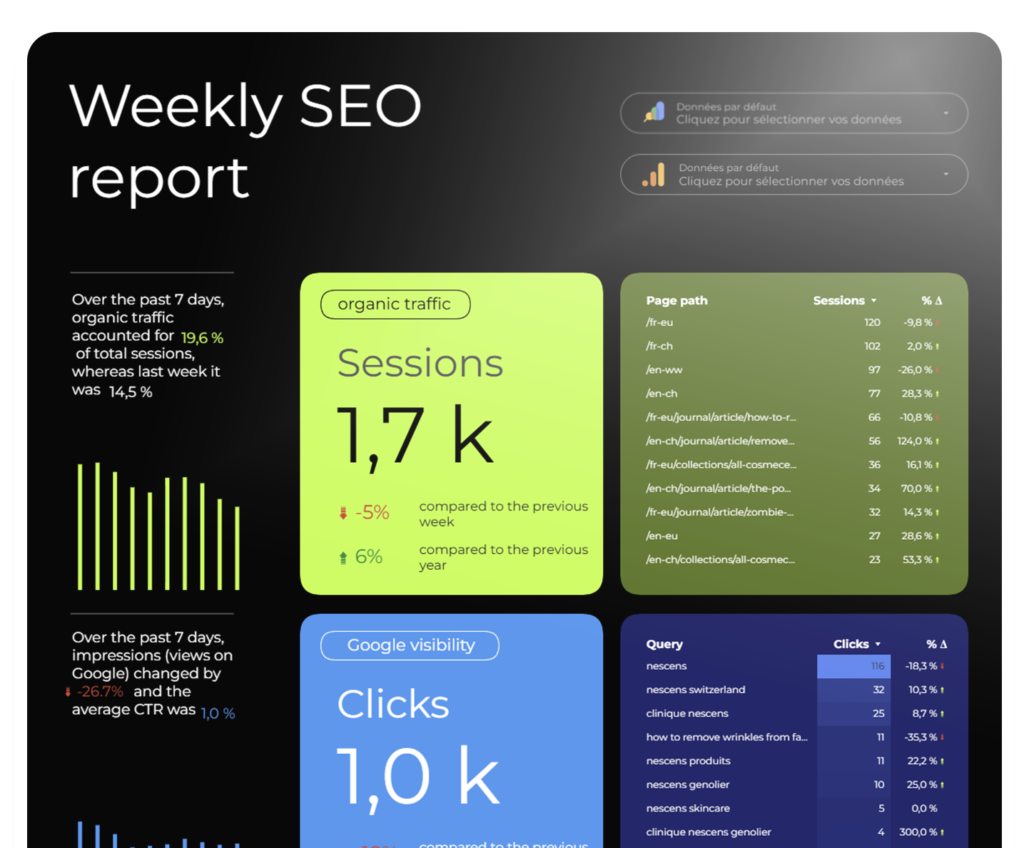
Visualize the evolution of SEO and GEO traffic as changes are made to the site and Google algorithm updates are implemented.
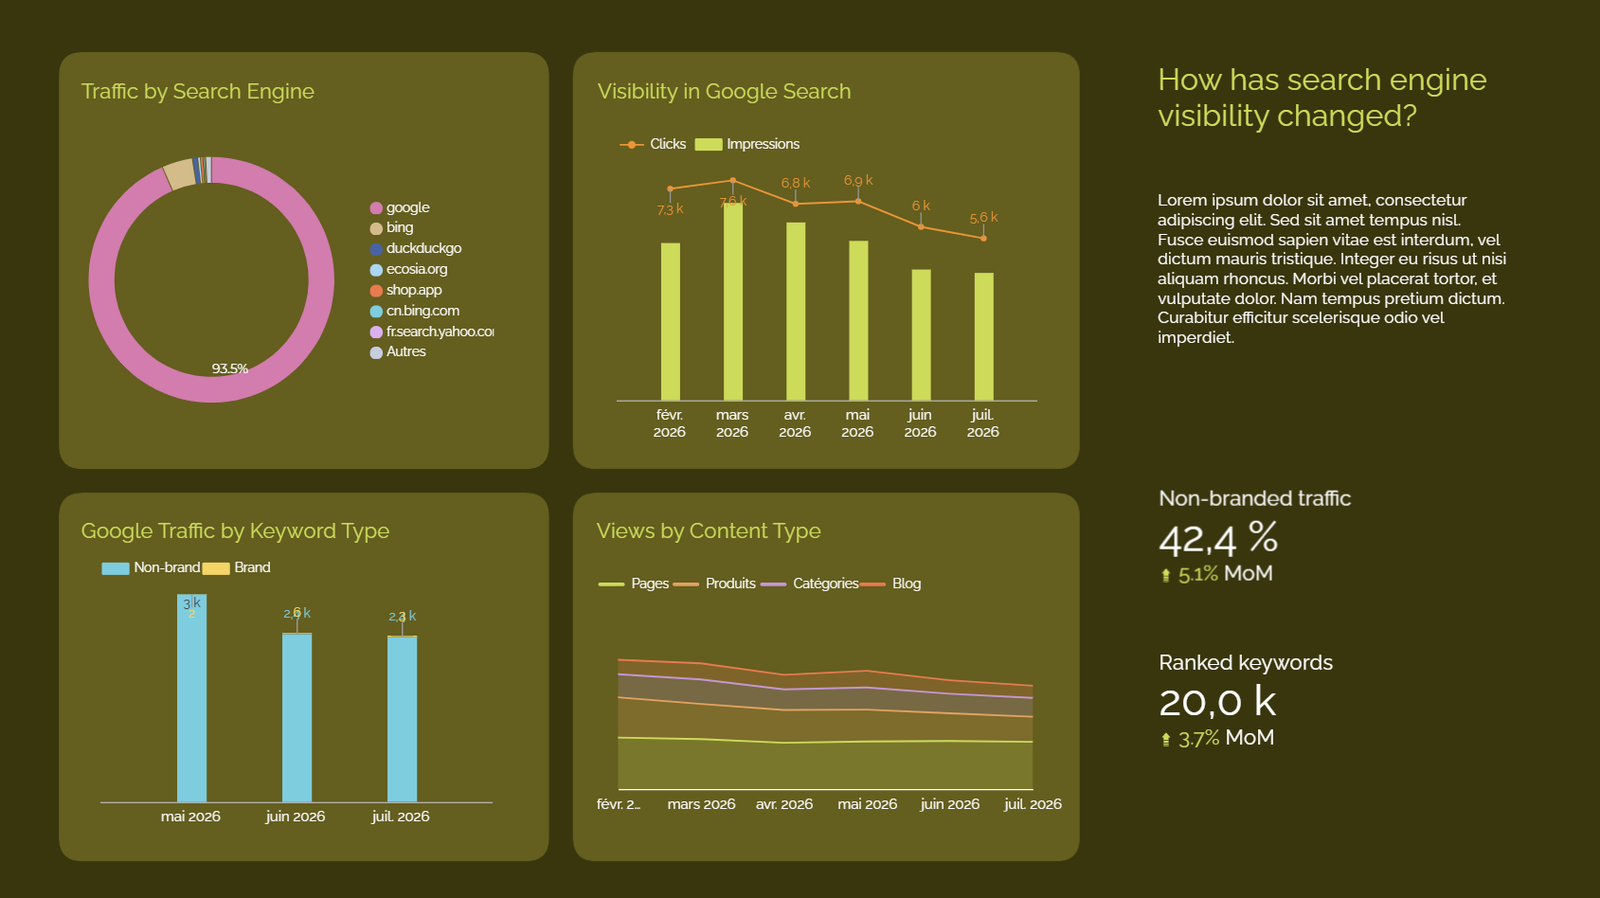
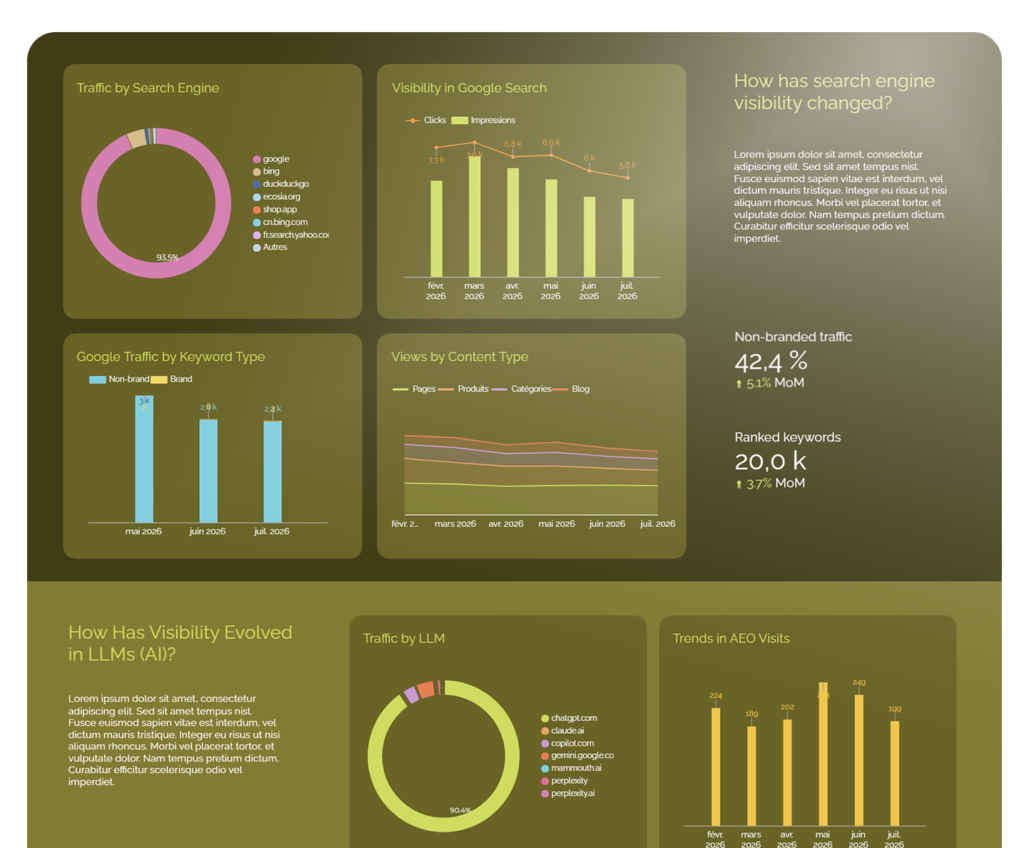
Page 4 – SEO Visibility
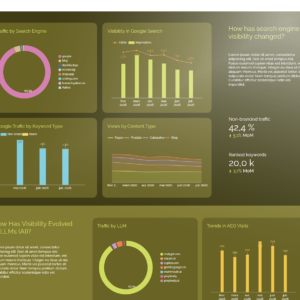
Monitor the site’s visibility on search engines, particularly Google, through the truly important KPIs.
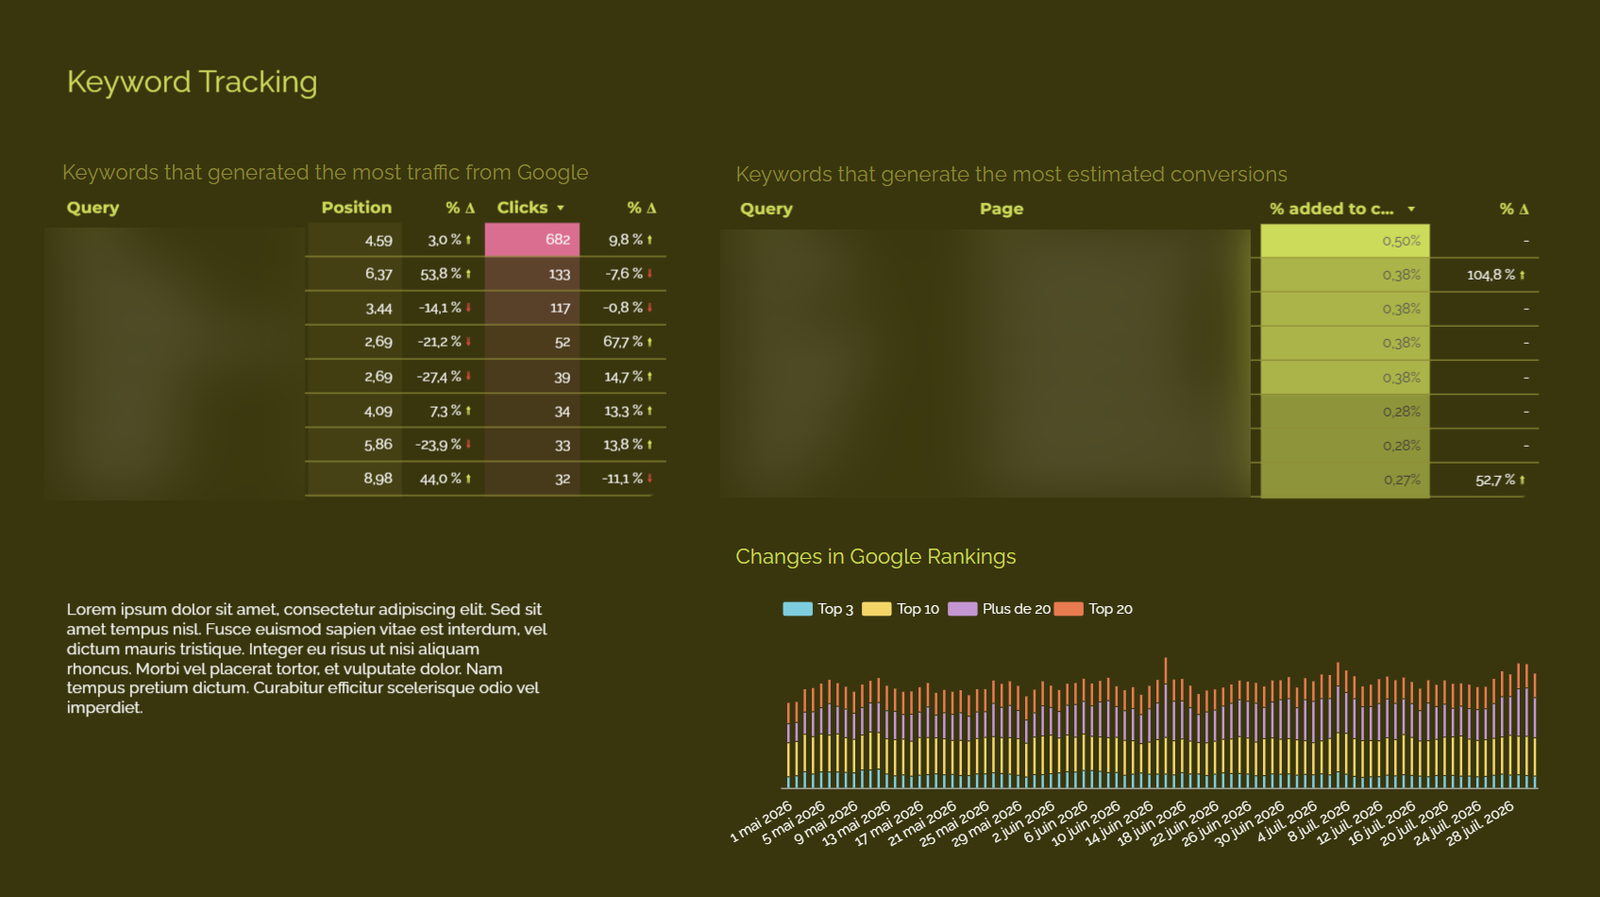
Page 5 – Keywords
Here you will find the top keywords on Google, the distribution of positions, and an estimate of the most profitable keywords.
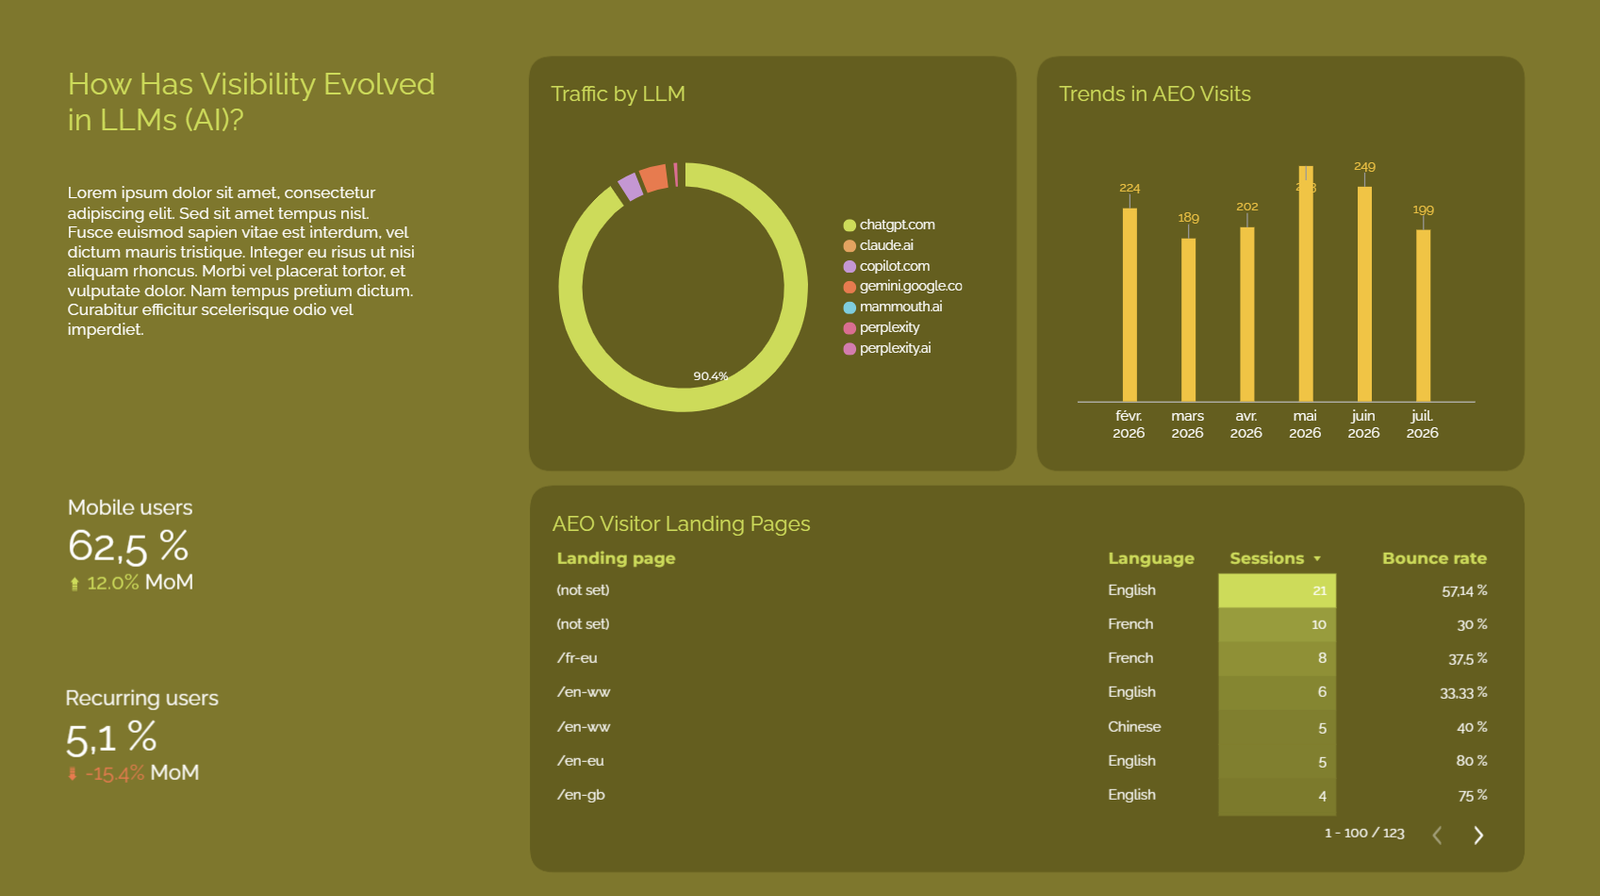
Page 6 – AEO Visibility
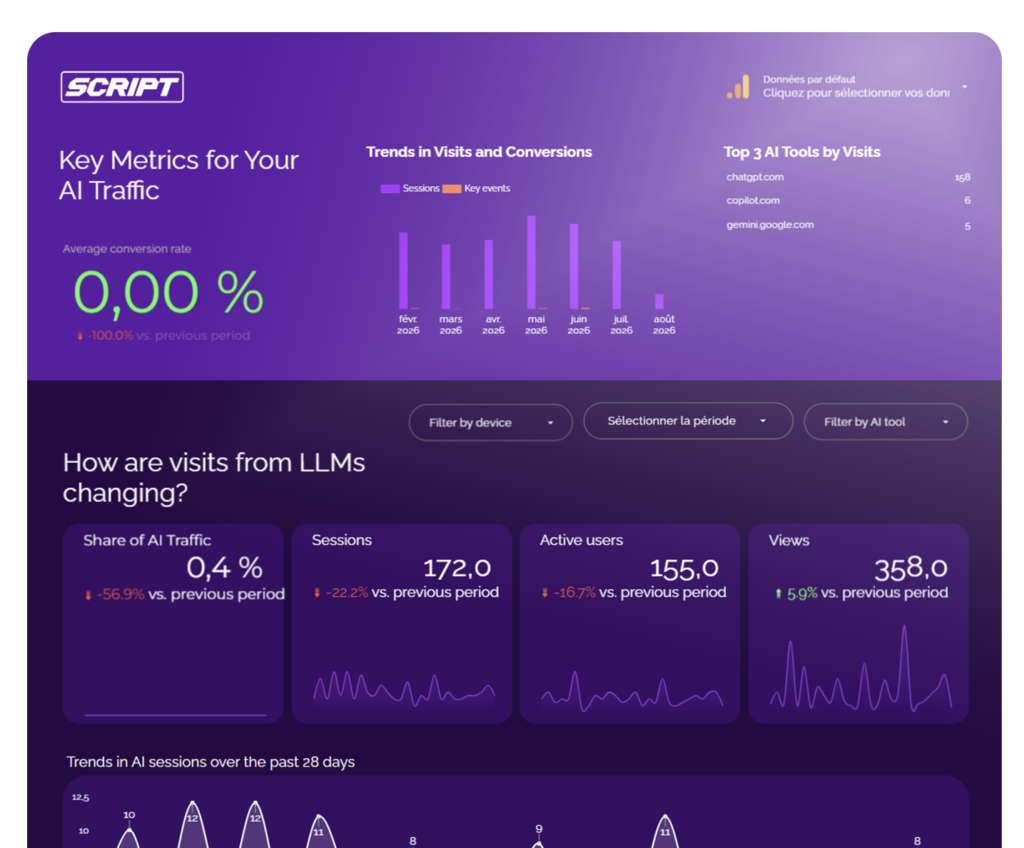
Access an overview of AEO (AI) traffic in an automated manner via GA4.
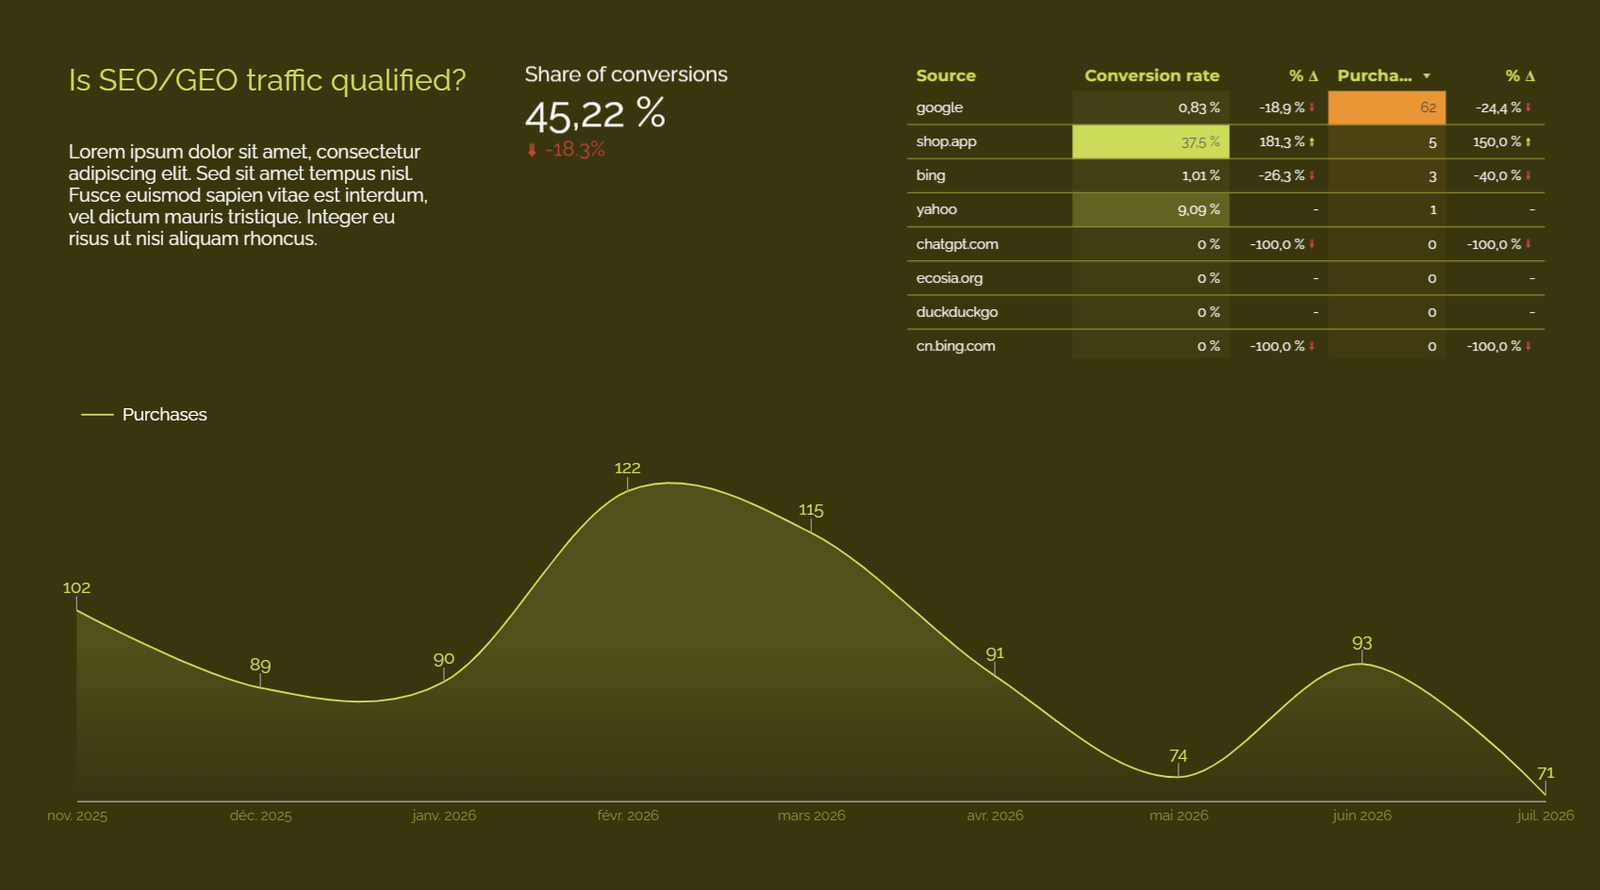
Page 7 – Traffic Quality
Show your client or management the quality of SEO and AEO traffic through its weight in revenue.
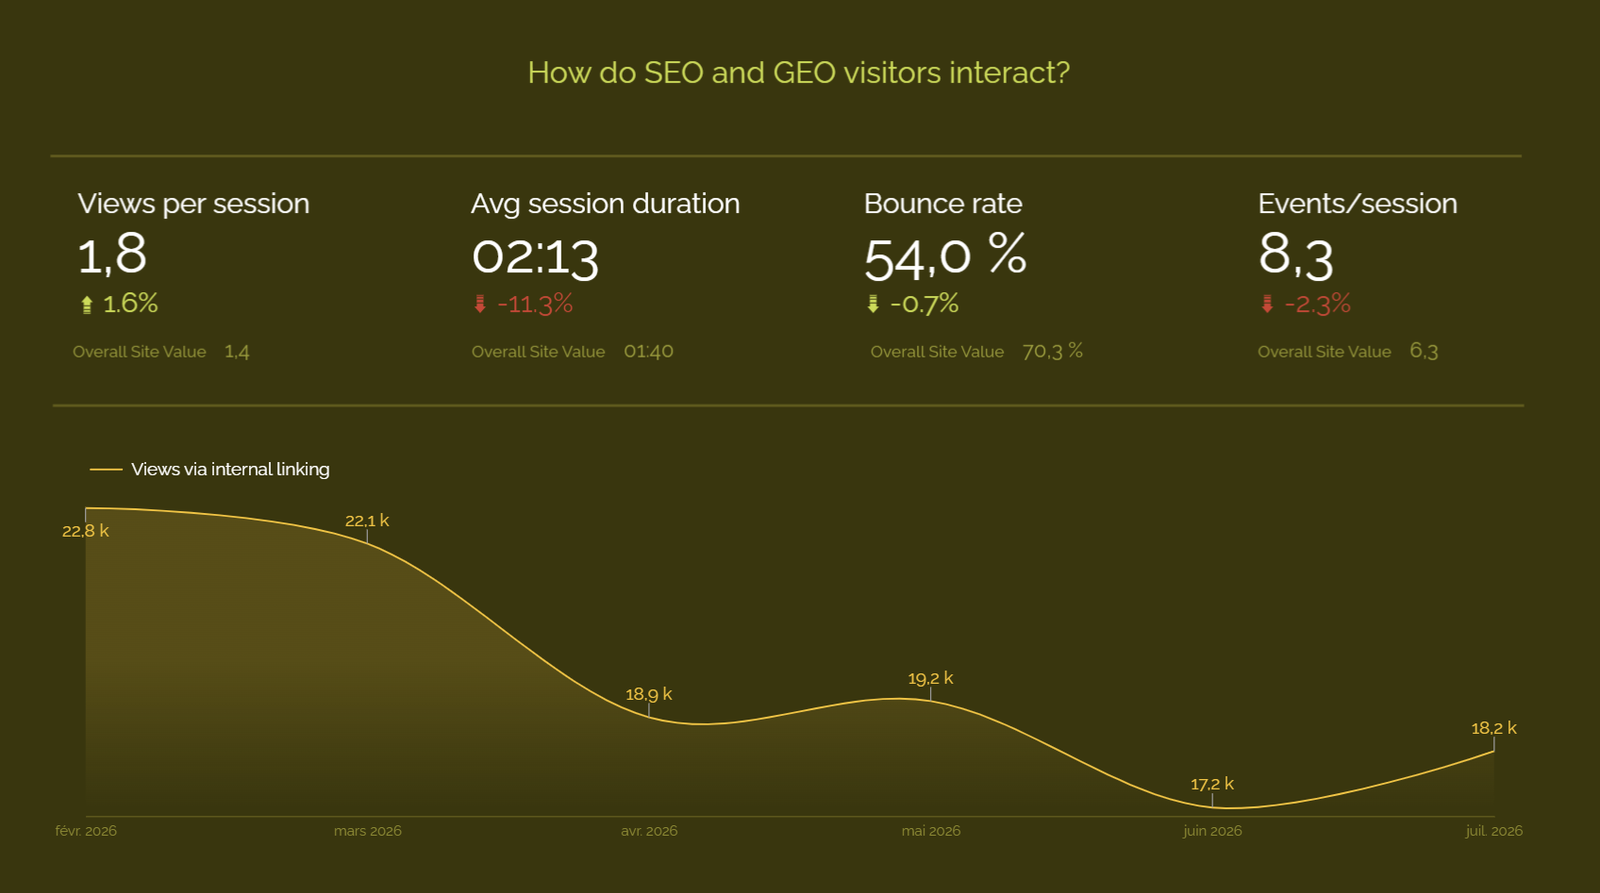
Page 8 – Interactions
Also monitor whether user signals are positive (an essential factor for SEO).
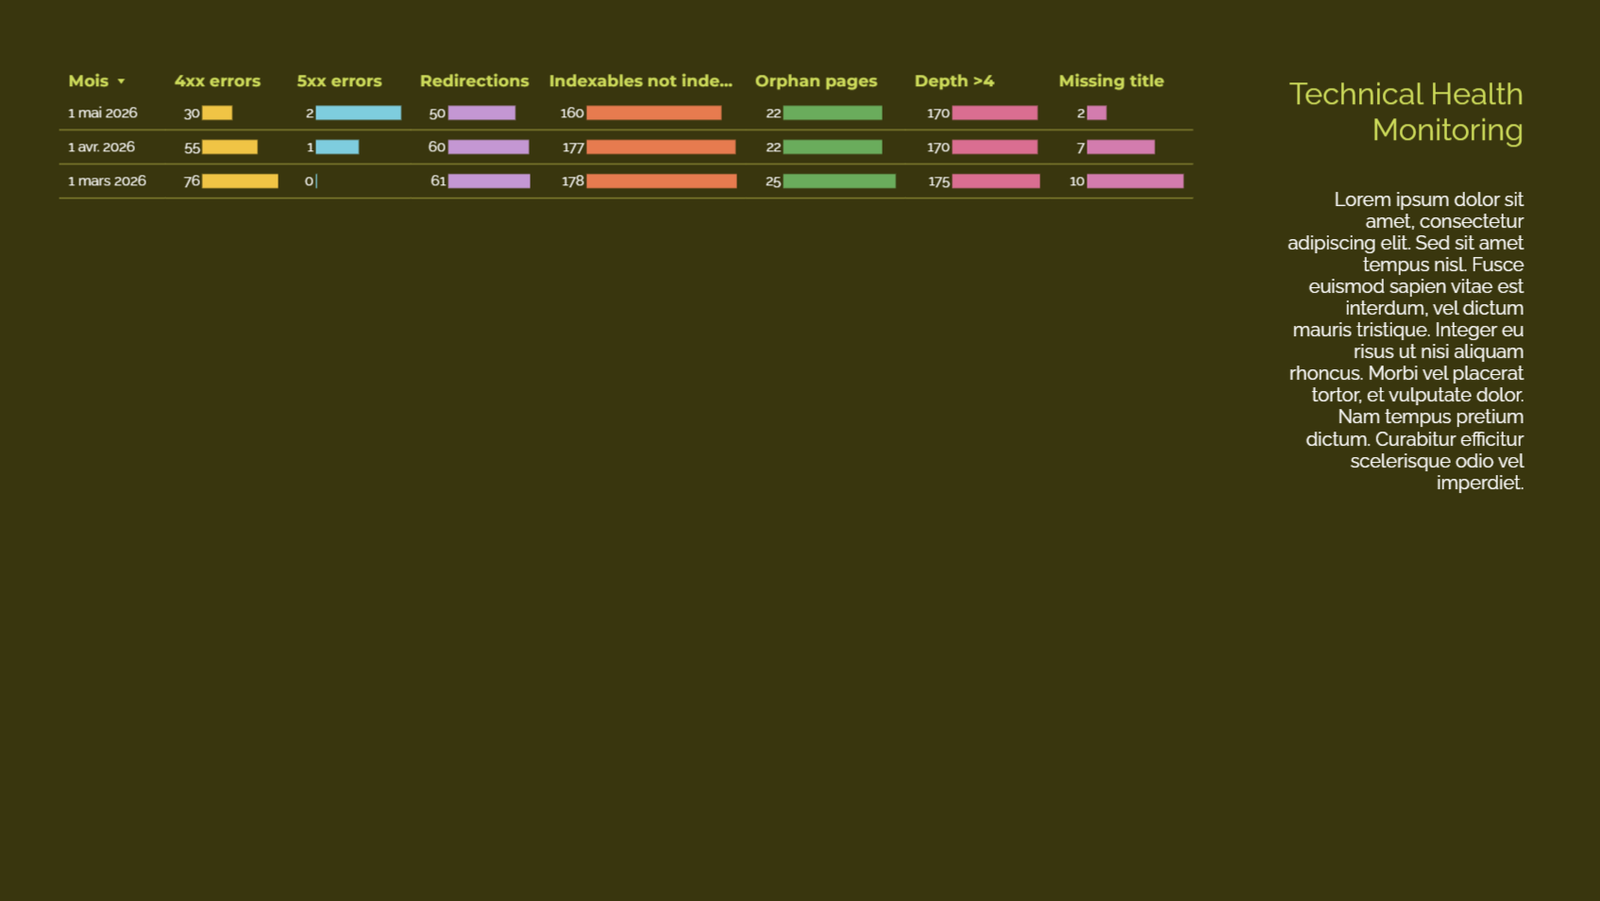
Page 9 – Technical Health
Monitor the site’s technical health over the months. This data must be entered manually into the Google Sheets file.
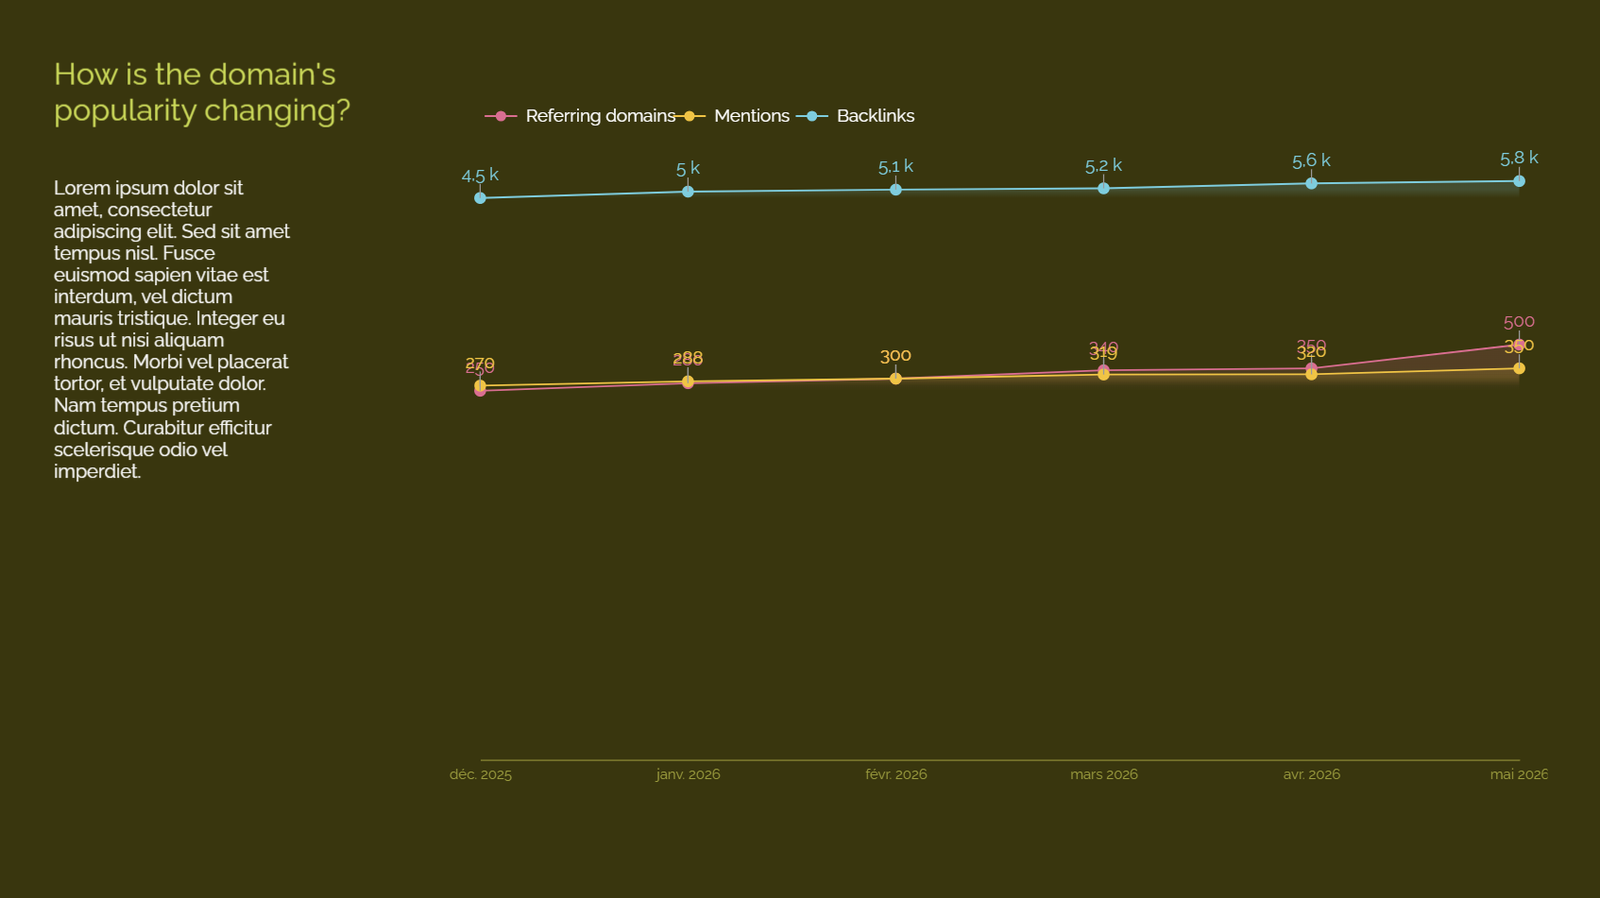
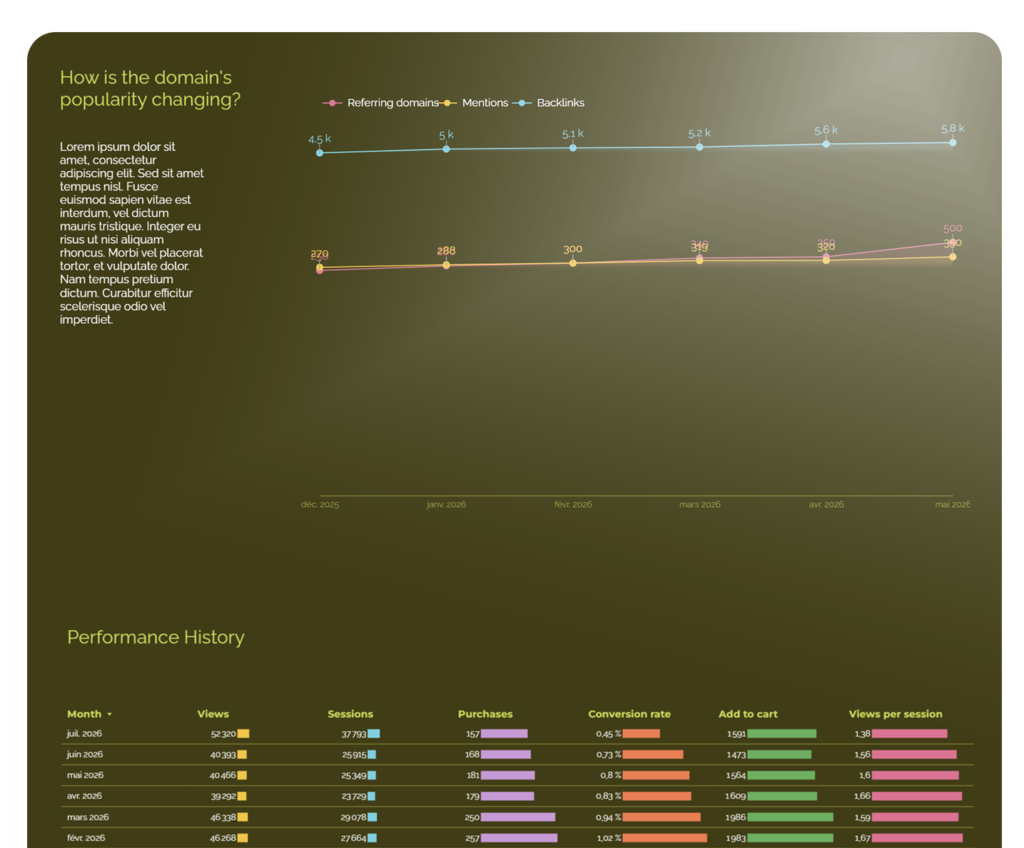
Page 10 – Popularity
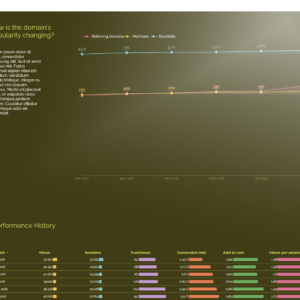
Track the evolution of domain authority (backlinks) and the number of brand mentions on the web (to be filled in manually).
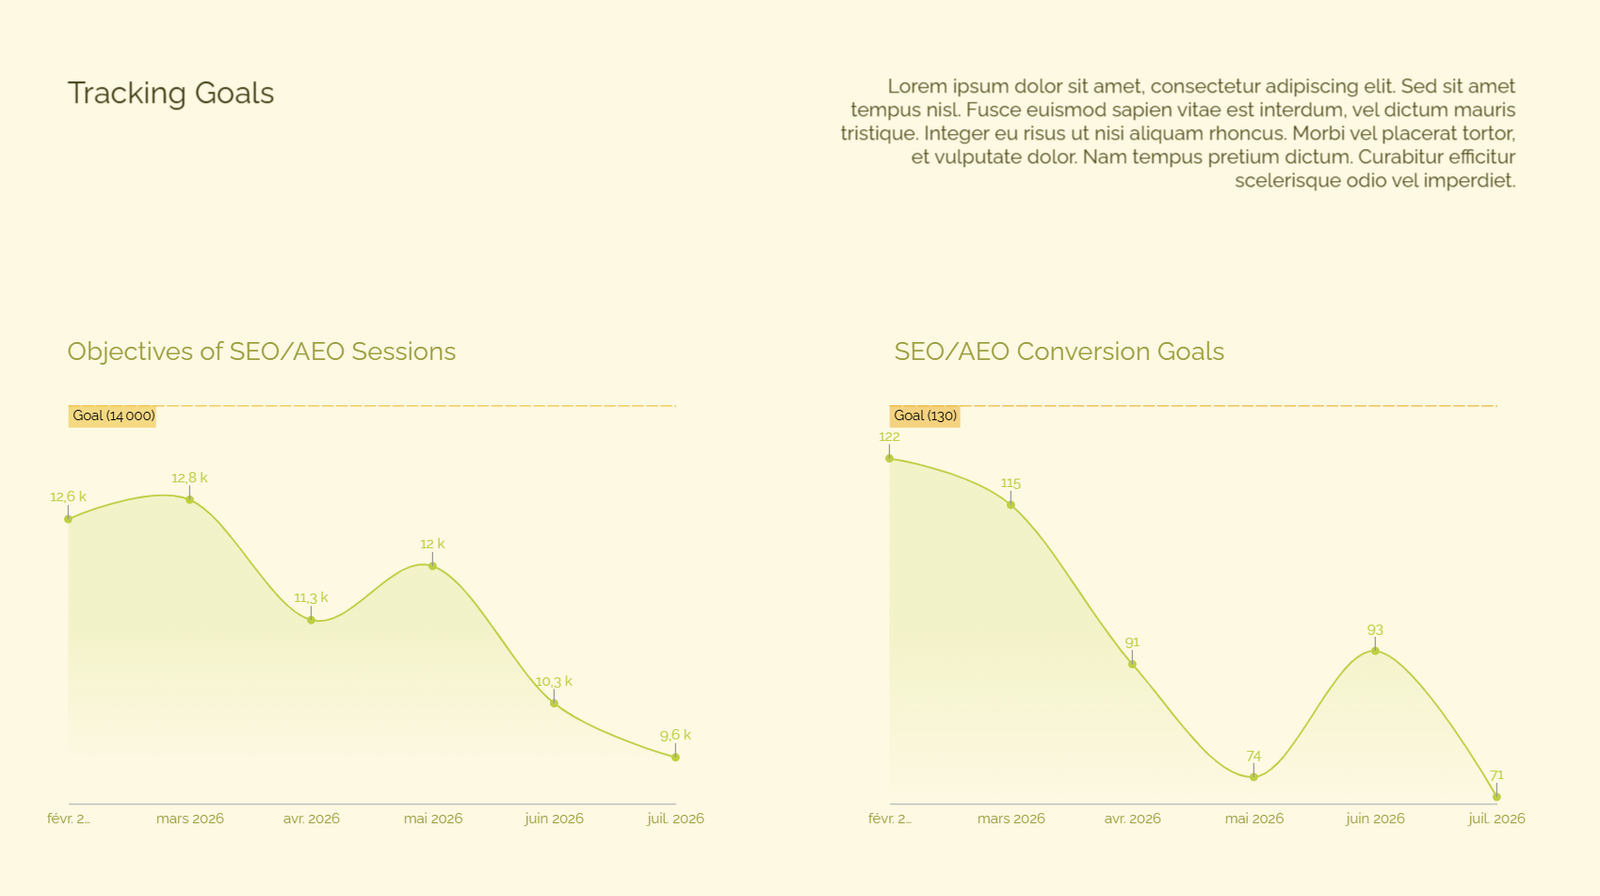
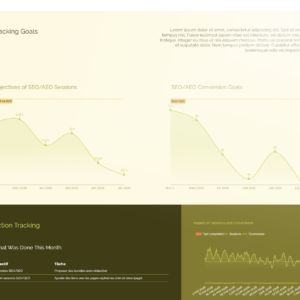
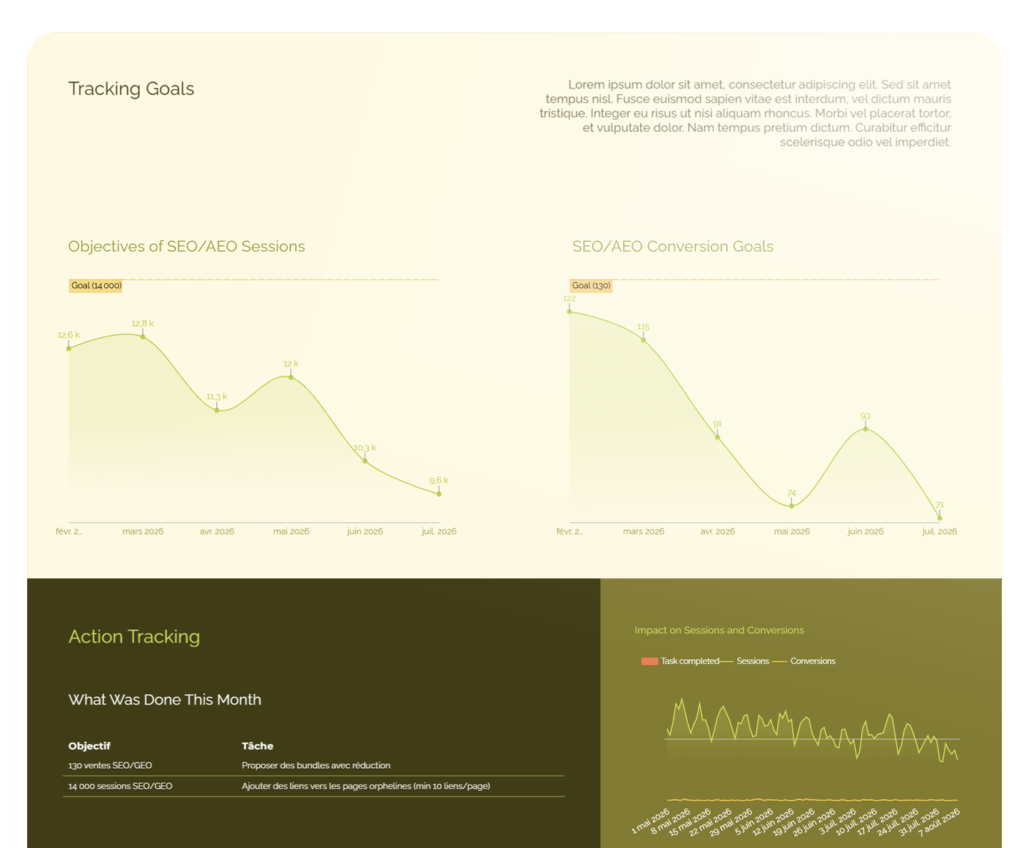
Page 11 – Objectives
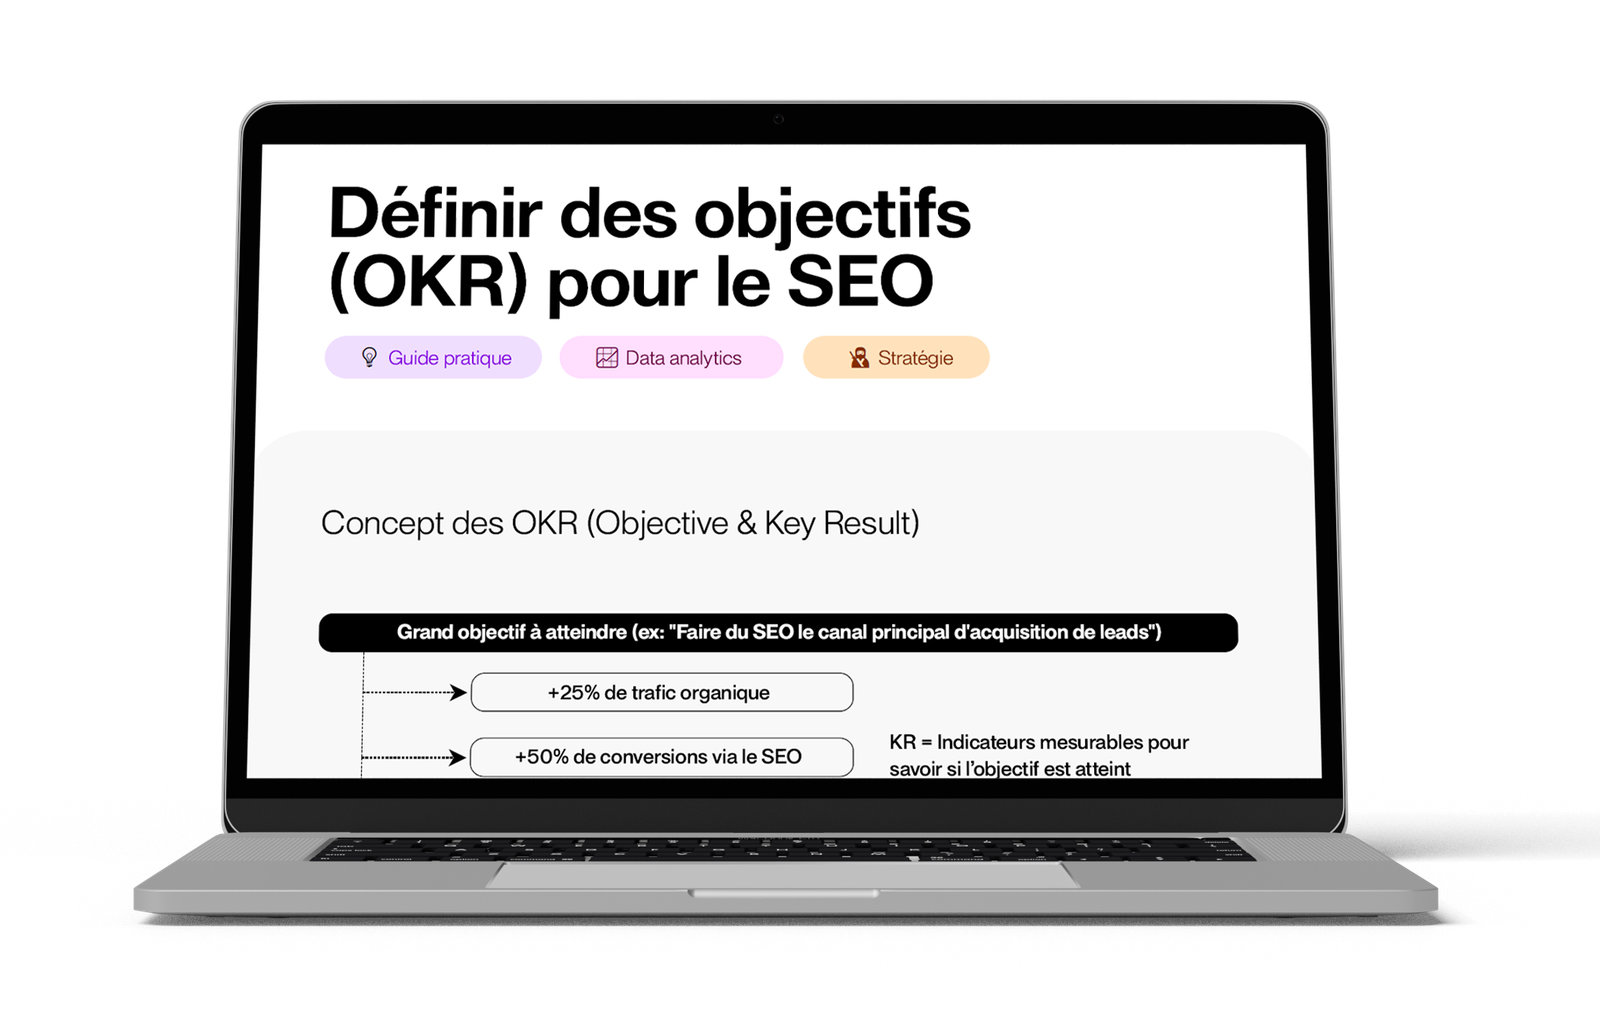
Show your client or management that the set objectives will soon be achieved with clear and automated charts.
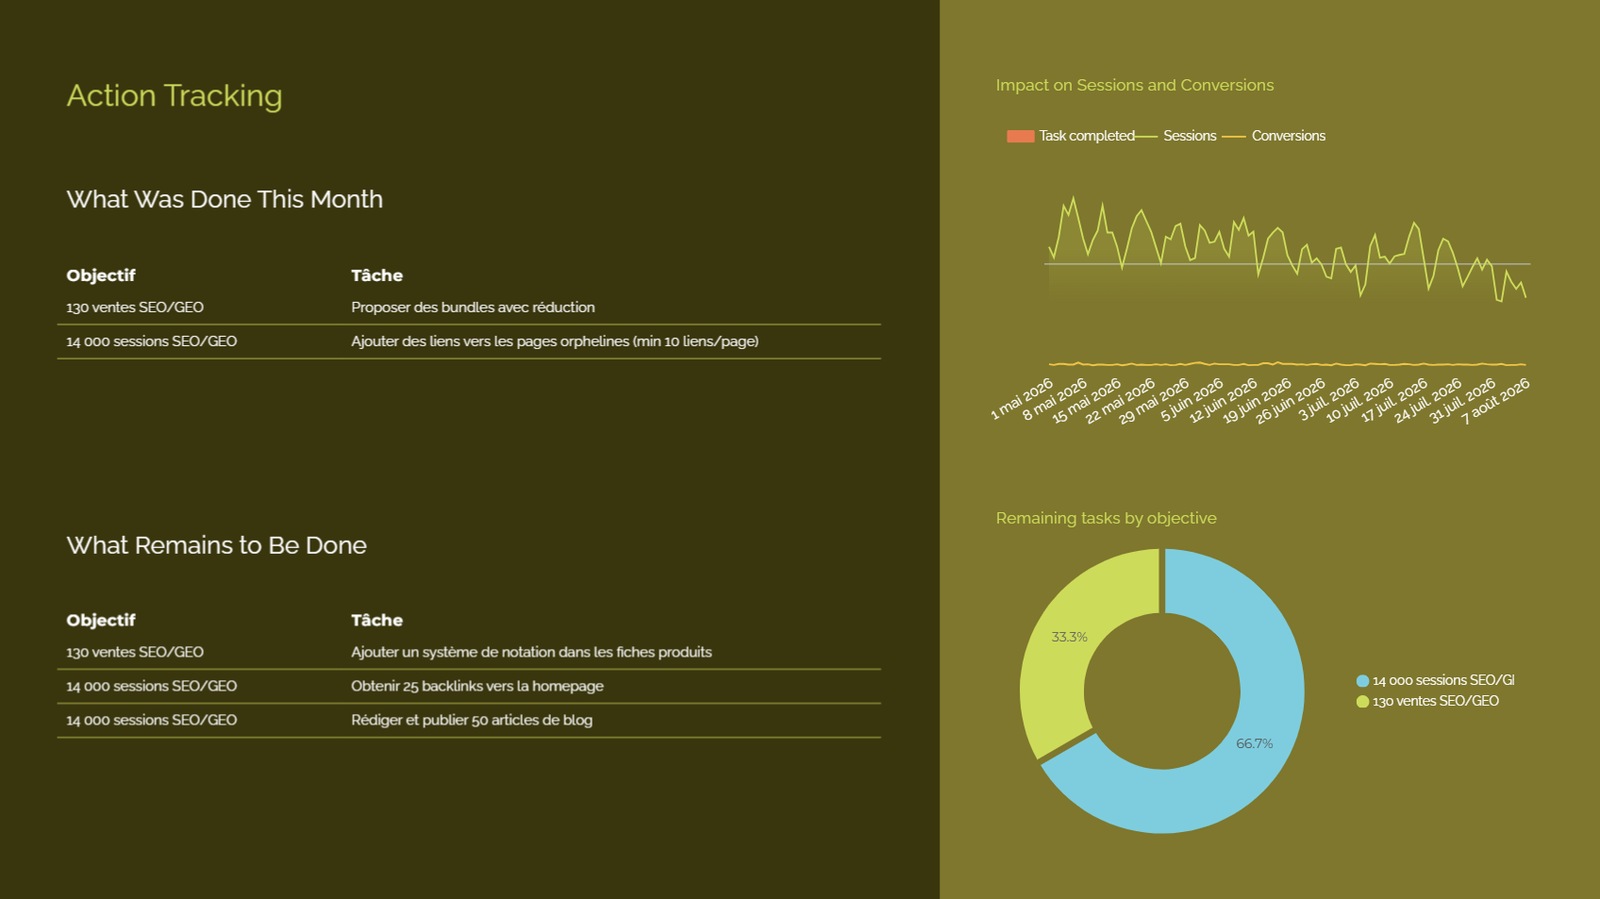
Page 12 – Actions
Use a single file for your goals and tasks; the reporting will take care of presenting them in a way that shows their impact.
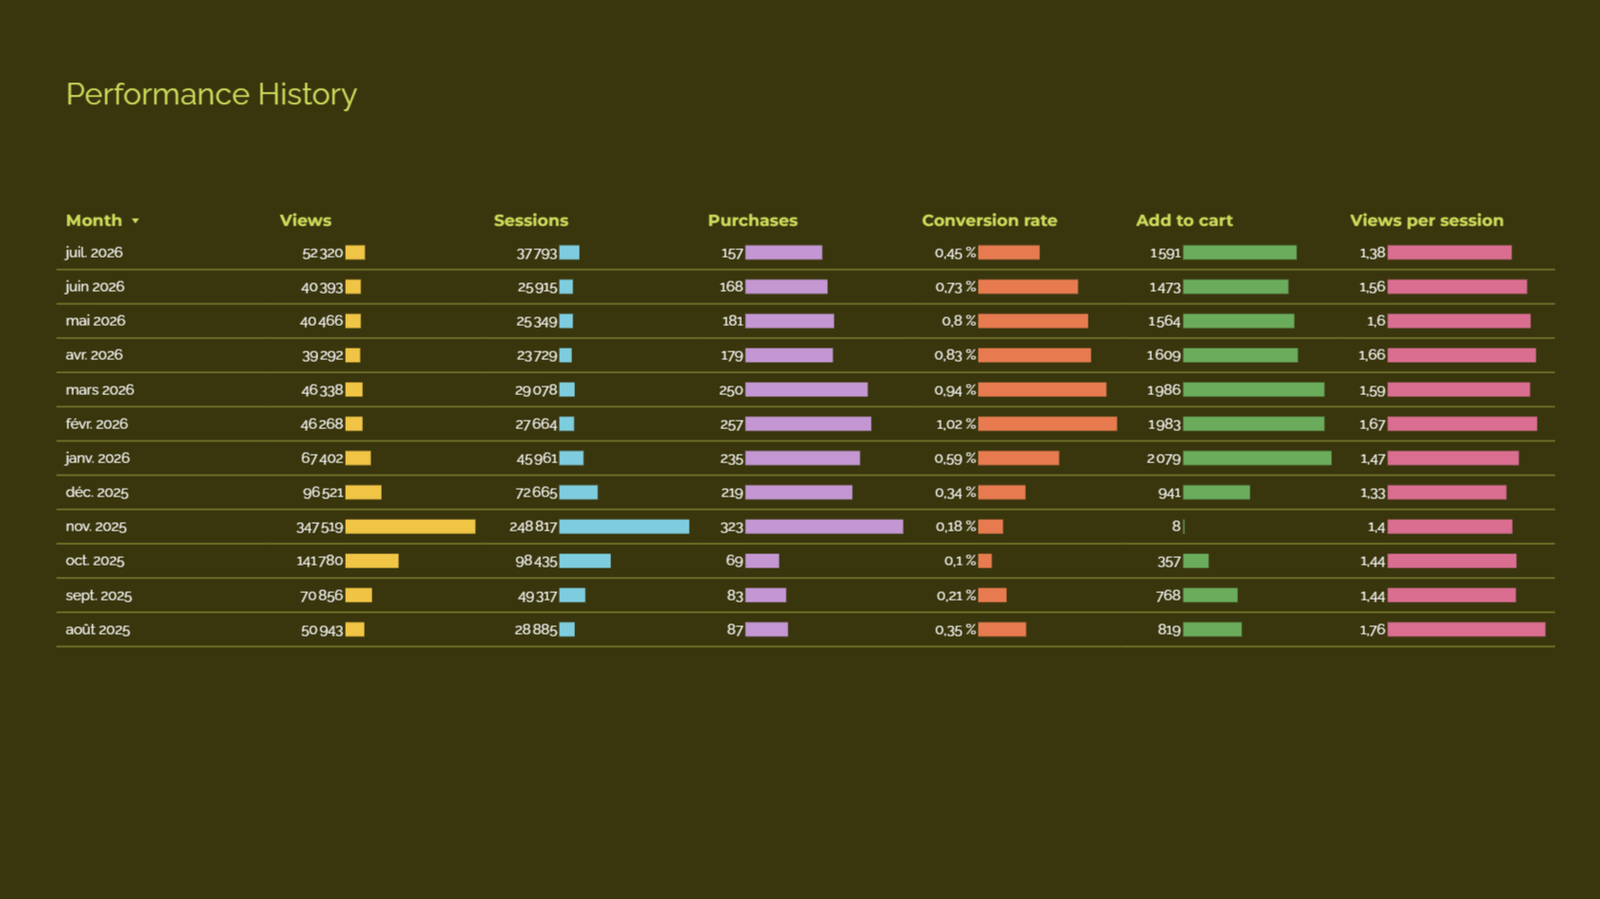
Page 13 – History
This graph allows you to see the evolution of performance month after month and to demonstrate the effectiveness of your strategy.
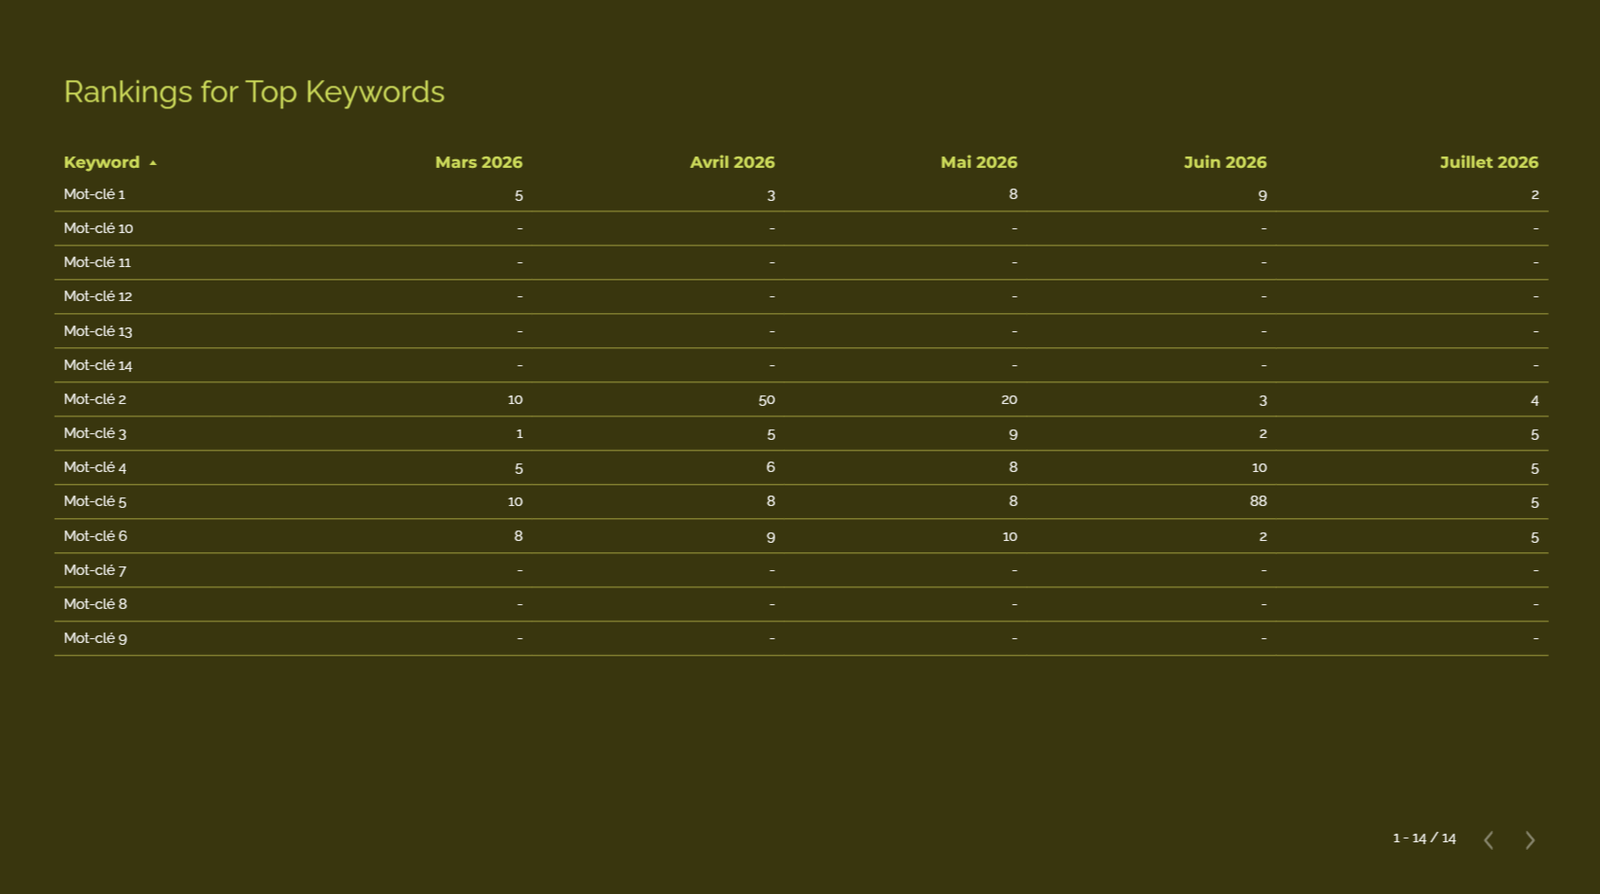
Page 14 – Positions
Finally, your client/management can view all positions on the most strategic keywords over the months.
For whom
His advantage
Most SEO reports are data exports, not decision-making documents. Rush’s structure is designed to answer the only question that matters to the client: “Is it progressing, and is it generating revenue?” The rest of the report is there to
demonstrate the correlation between actions and results.
The other structural difference is
the native integration of GEO . While competing tools still ignore visibility in generative AI, Rush measures and tracks it automatically. By the time your customers start asking the question, you already have the answer.
What you get
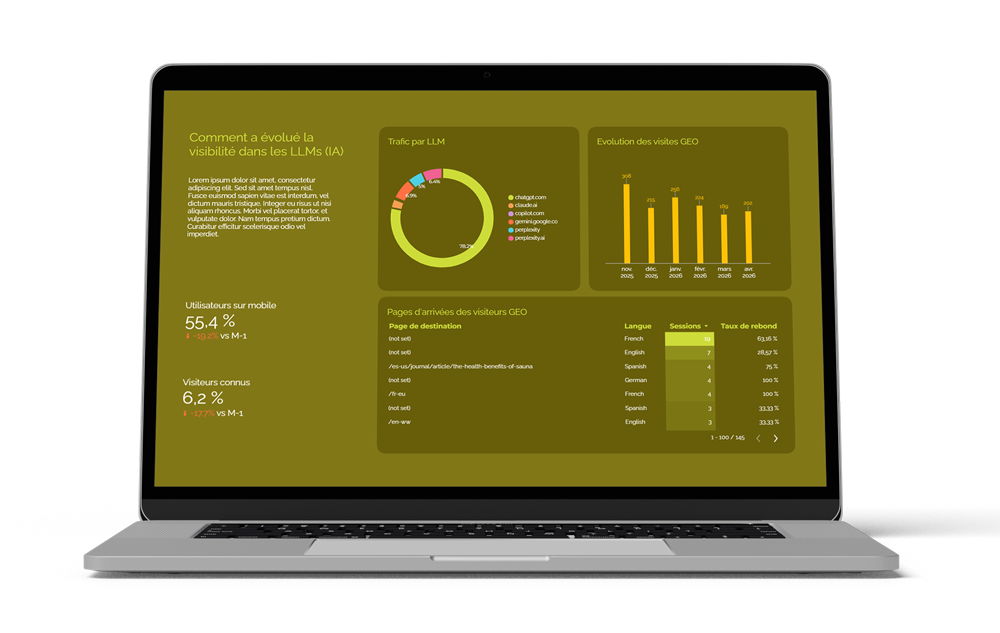
The Data Studio template to duplicate
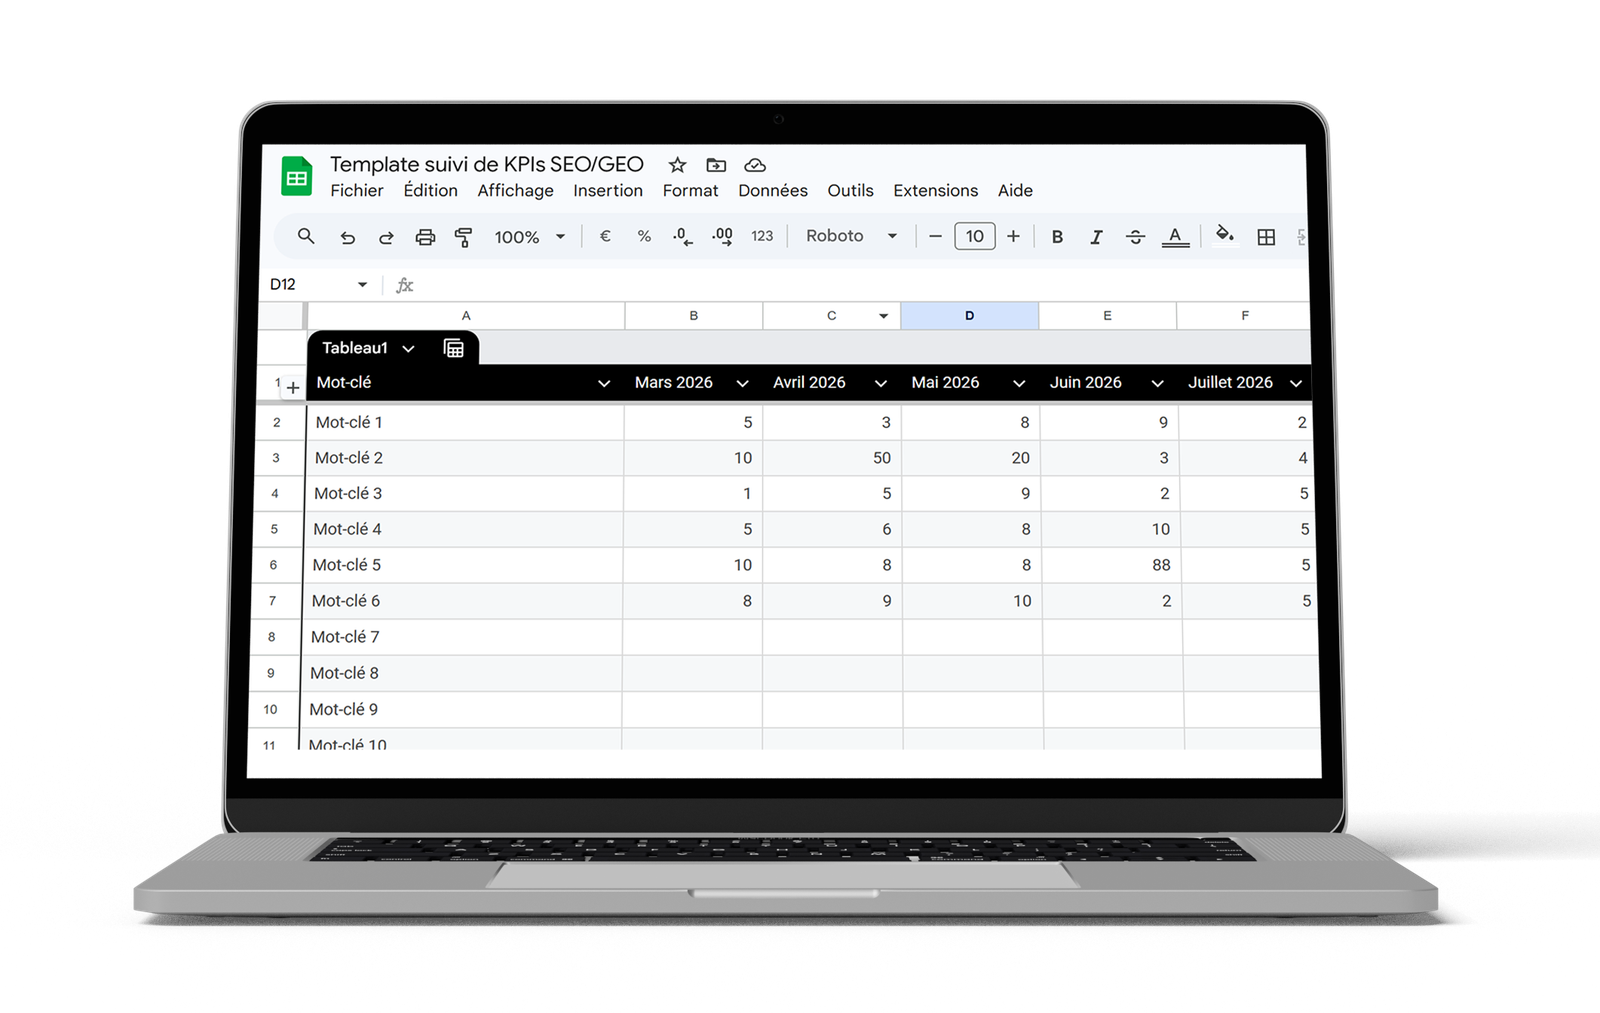
The GSheets file for filling in non-automated data
Technical documentation for getting started
Reviews
There are no reviews yet.